MENU
Show navigationFXStreet
Ken Chigbo Ken Chigbo
FXStreet
Follow
Bitcoin technical analysis: BTC/USD needs to breakdown $12,000-12,500 for chance at $15,000
CRYPTOS | Jun 28, 15:20 GMT
Share on Twitter Share on Facebook Share on Linkedin
Bitcoin price is trading in positive territory, gains of some 5% on Friday in the second part of the session.
BTC/USD managed to catch support from an ascending daily trend line.
The price underwent a large correction on Thursday, which has seen the bulls buy those dips.
Spot rate: 11,725.45
Relative change: +5.50%
High: 12,099.98
Low: 10,739.16
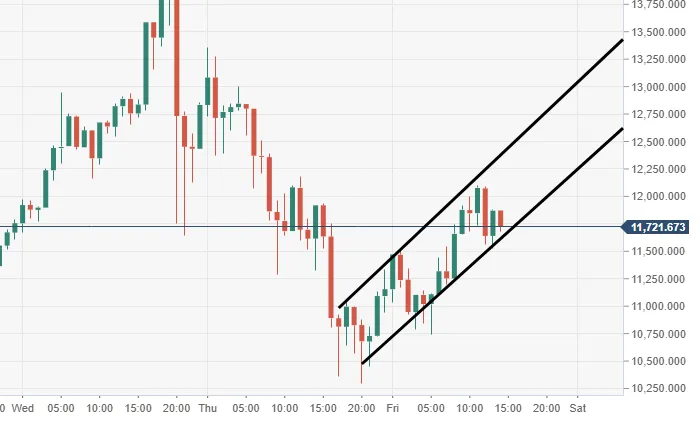
BTC/USD 60-minute chart
Near-term ascending channel formation, which could be viewed as a bearish flag.
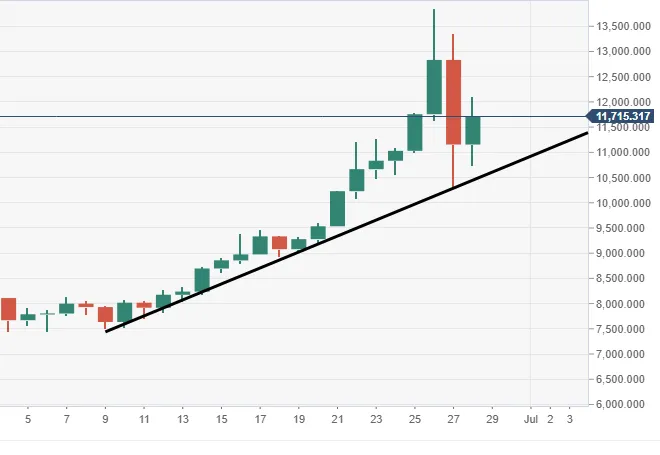
BTC/USD daily chart
Price action via the daily has managed to catch support from an ascending trend line.