BTC is starting to look really bad again. If people don't start buying very soon, we will see this WXYX2Z pattern complete, that I pointed out as an alternate for the first time already in January 2018:
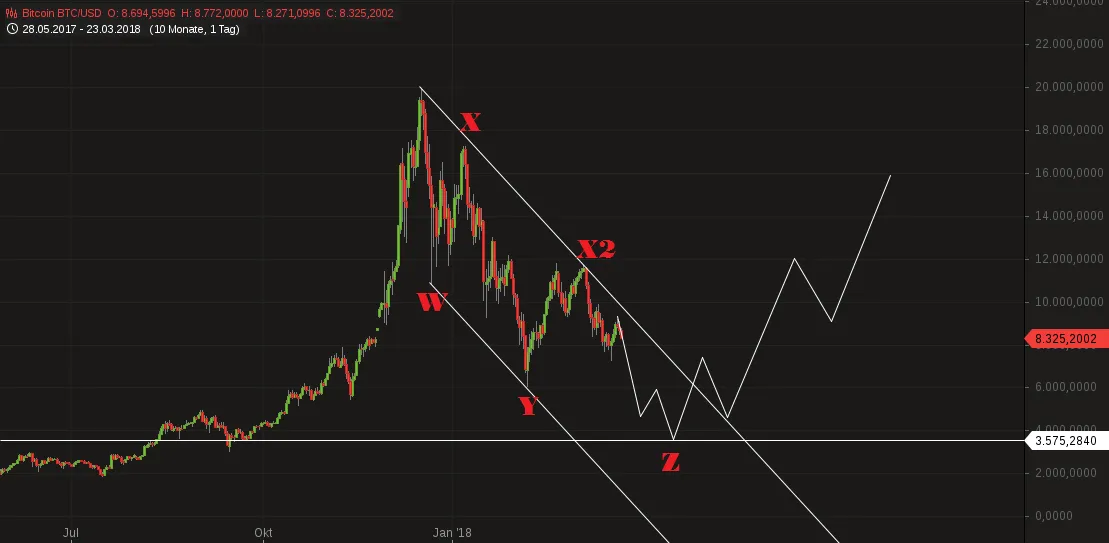
Some of you may remember this pic... It was very unrealistic at the time I created it.
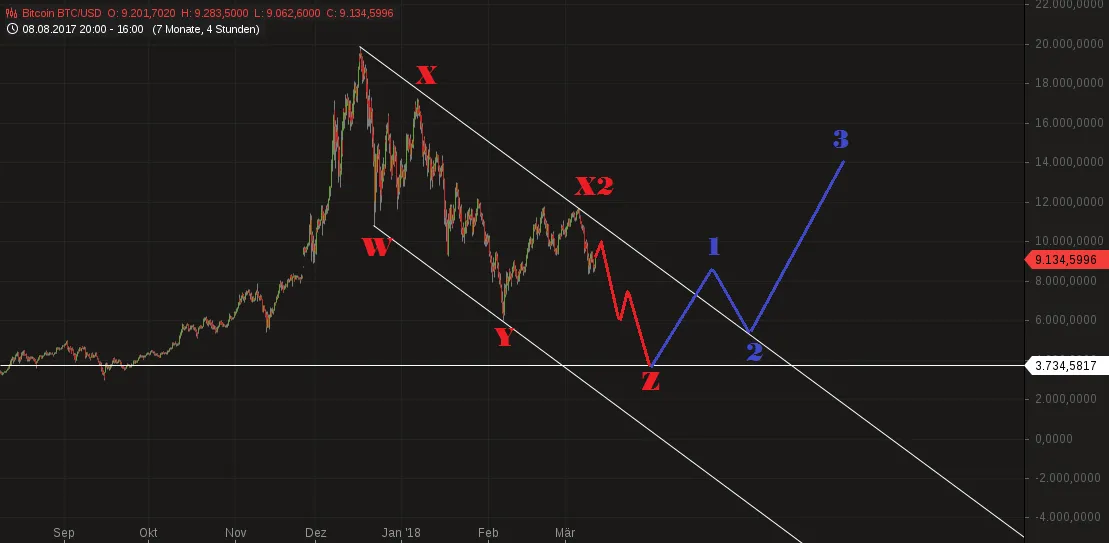
Not so anymore. My target zone for wave Z (if it completes this pattern) is 3,800$ - 2,800$ BTC. 2,800$ also equals the 86% fib retracement target.
But unless there is a new low below 7300, this is still my primary count:

If you think this to be useful information:

Feel free to use and share my charts, but please mention me, @ew-and-patterns as the author. Otherwise it is considered plagiarism and I will flag you and advise my friends to do the same.
MUST READ!
DISCLAIMER: This post / analysis serves general information purposes only. I am not, and never will be a financial adviser. The material in this post does not constitute any trading advice whatsoever. This is just the way I see the charts and what my trading ideas (from my personal experiences) are. I use chart pattern and Elliott Wave analysis for my trading ideas.
For full disclosure: The author of this post is holding positions in this market at the time of this post. Please conduct your own due diligence, if you plan to copy anyones investment decisions!
If you make any trades or investments after reading this post, it is completely in your own responsibility. I am not responsible for any of your losses. By reading this post you acknowledge and accept to never hold me accountable for any of your losses.
Please consider leaving a comment, like or resteem, if this post entertained you or helped you see things differently...
Have a nice day :-)