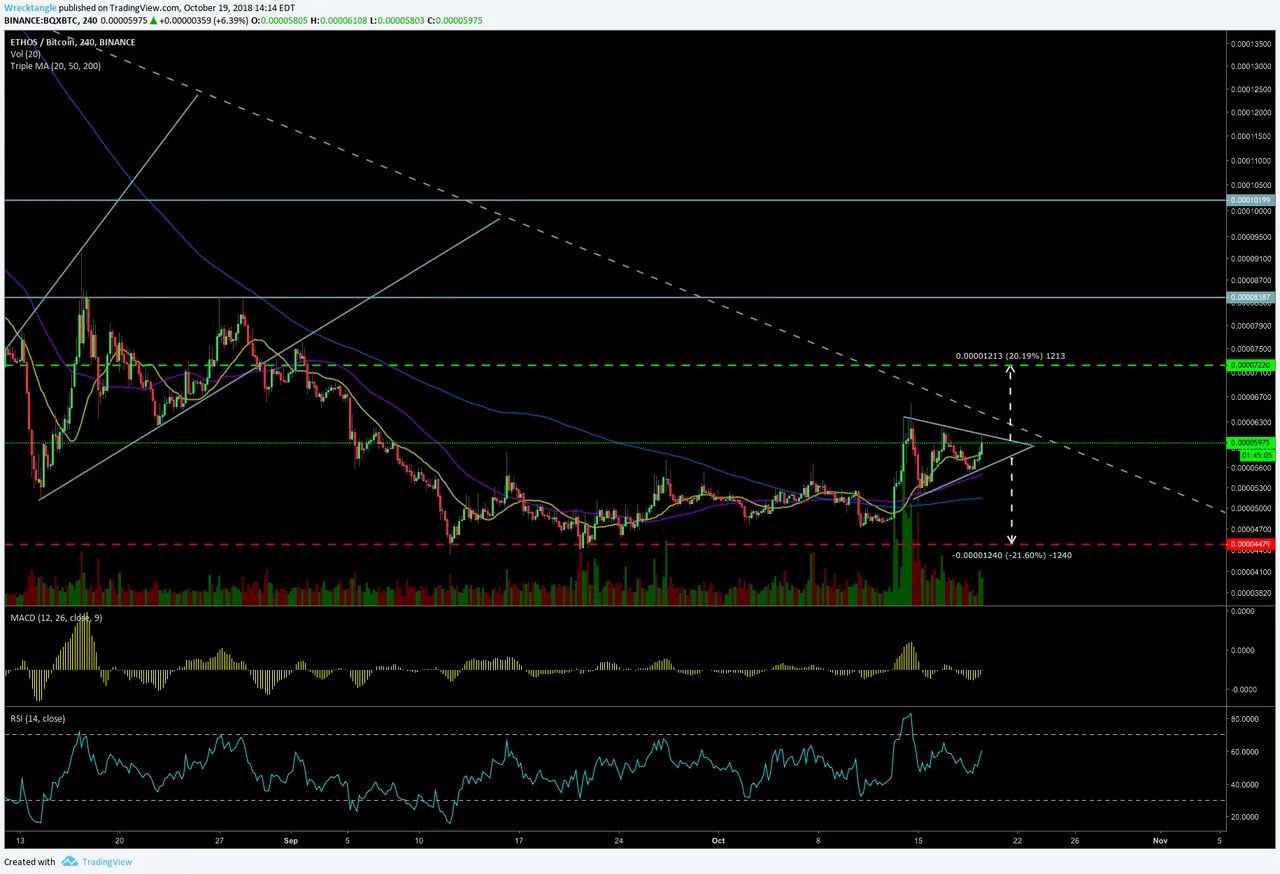
BQX approaching the end of the consolidation phase inside a very well established symmetrical triangle. There are a few scenarios which may pan out in the next few days:
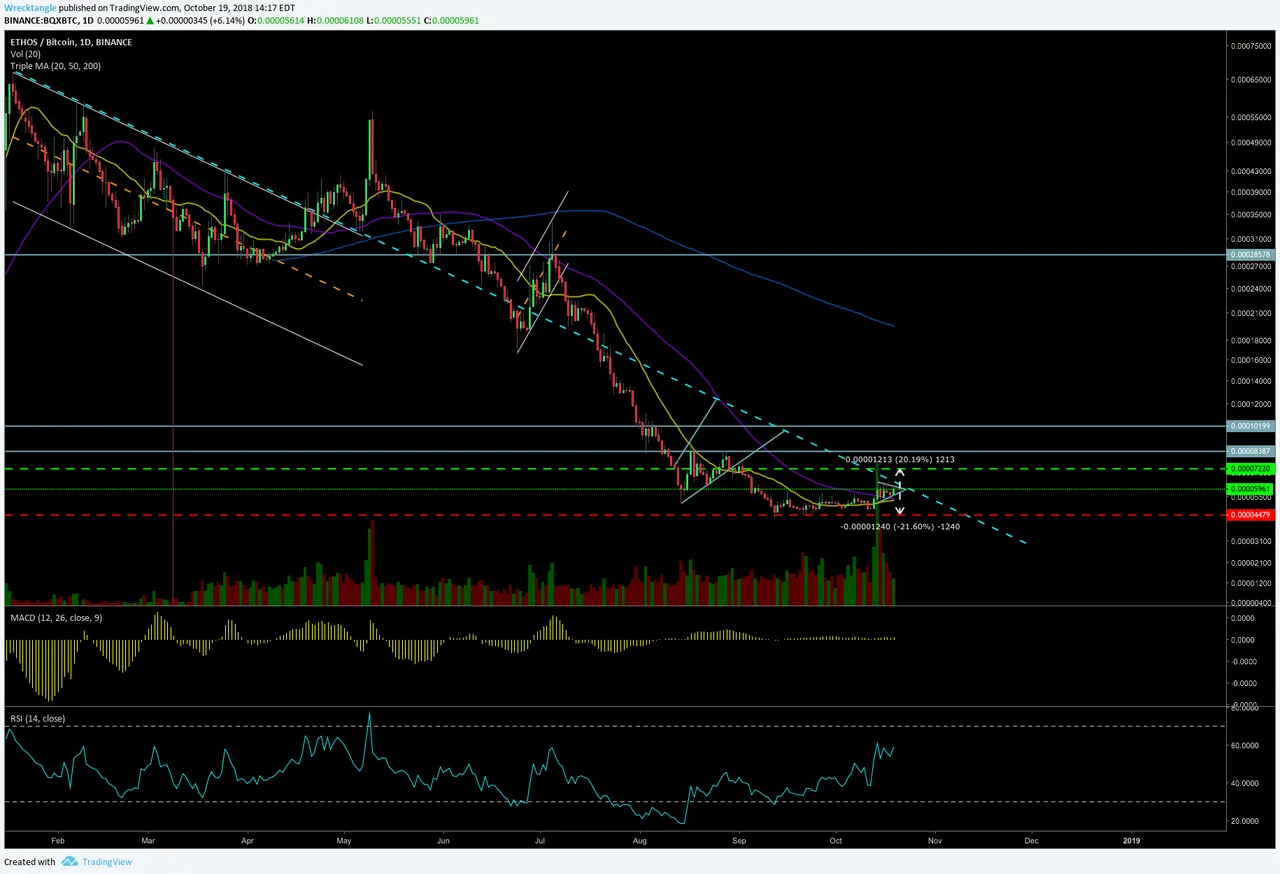
Firstly, we got to like what we've been seeing out of BQX lately. Running up with good volume and momentum. Now we have to evaluate which way we think this will be heading. Our indicators aren't much help right now. Neither is giving us any divergence so we can scratch that off the table for now. What we can see by first glance is the approaching diagonal trend line which has played as key support and resistance in the past.
You can see that here on the daily:
Now, seeing as this has been such a critical zone for BQX in the past, we must get convincing volume and momentum to make a breakout valid out of the symmetrical triangle. A break out would put you at a minimum target at 7220 SATS. If we do in fact get all those factors in place, we can start getting bullish mid term on BQX. However a break down out of the triangle would bring you back to your yearly lows around the 4480 SATS area. It's a very wide range, but thats what its showing me right now. Keep in mind, we very well can break to the upside and we can keep back testing that diagonal trend line, but in a downtrend as its also done in the past. What would make make this more bullish is breaking the horizontal resistance at 8387 SATS. This would be a higher high on longer time frames which is always great!
In my opinion, we haven't tested this diagonal trend line as resistance since April so maybe we give it more validity and get rejected again, hit our lows again, and continue carving out our bottom as its looking on the daily. That would be the most natural price movements seeing as it would be showing key support at the lows, testing the overhead resistance, and give us a better idea where to open positions in the future. The good news is, on shorter time scales, that the MA's are curling upward and your 50MA crossed above your 200MA for the first time since July. Always nice to see.
Either which way we go in the next few days, it will tell a very detailed story whether we can muscle off the bears and start a temporary bullish trend, or continue showing weakness as we have been showing all year long.
Hope this helps!