It's been a lot of time since I've participated in an ICO. I haven't done daytrading for months, since I was only investing and getting profits from ICOs.
Now, I wanted to learn some Technical Analysis terms and graphics, so they can tell me when it is time to buy a coin, when it is time to sell. I believe (as I can see) it really works, mostly. Of course in this crypto world, there are whales, market makers . They can always interfere with bitcoin and other coins' normal behaviour.
Yet, let's learn some TA. Here are some cheatsheets:
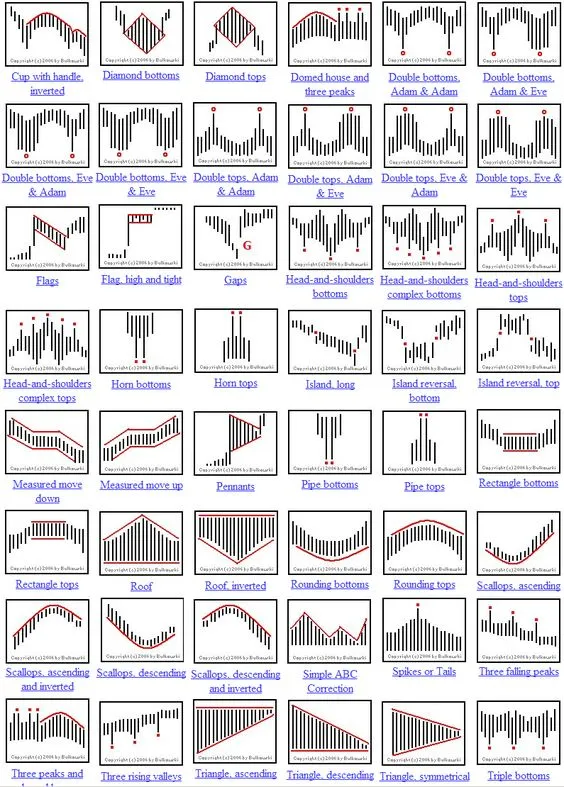
(from https://tr.pinterest.com/pin/561824122247986571/)
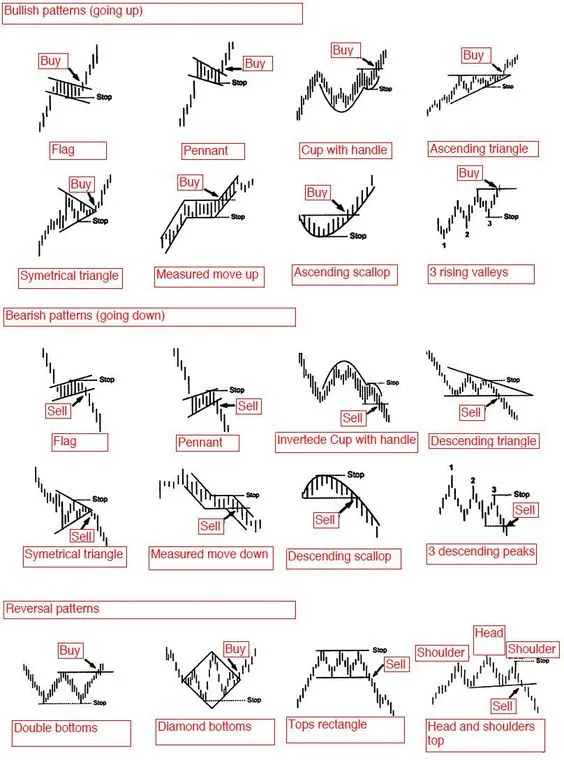
https://www.pinterest.co.uk/pin/744290275889091696/
Some coins I have made triple top and triple bottoms, but I wasn't aware of these things at that moment :)
you can check coins graphs by looking at a trading app like Tabtrader, Binance (etc. official exchange apps or websites) or most likely Tradingview.com. In tradingview people can also create their own schemas, you can use them (if you find them useful.)