Sometimes it's better to step back a moment and see the Bigger Picture sometimes, and that's with all things as well as Bitcoin, the most powerful Crypto there is. Below is the 1day chart showing BTC's path to where it is now.
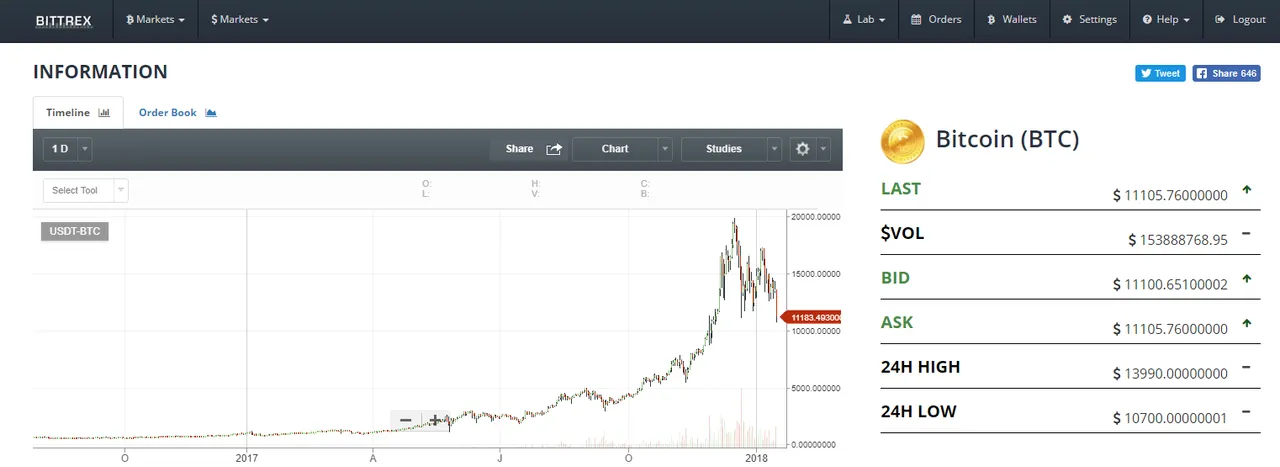
Based on my non professional view on the chart and market trend is you should have expected this. A major price correction. It's perfectly normal in any new market to go through what we call Growing Pains. It's a natural cycle that follows psycological behaviors of traders in the market. Look at it this way... Everyone buys expecting to sell at a higher price. So why does it drop? When it rises as fast as BTC did from $1k to $15k it is very exciting and can make those who are already invested a lot of money. On the other hand, it's rise happened so fast that no true base, or bid support, was ever formed. You could look back to $8k or so before any real base was formed.
Appears also we could be in the downward pattern of a ABC wave cycle. If we are expect the price to test support at $10k and even as low as $5k. I'm thinking realistically $8k by the end of this wave. What happens when the wave is over? As the price drops more and more buyers will eat up all those coins at higher base level prices so when the bulls start overpowering again taking advantage of the cheap prices the Start of the infamous 2018 Bull Run will start and be EPIC!
Let me know some opinions on how far down BTC will drop. $3K? $5k? $10k?
My Favorite New Trading Platform/Exchange: KuCoin.com

If you enjoyed this reading material and or found it useful then
Follow me for market alerts. @jdean - AKA - BigPac