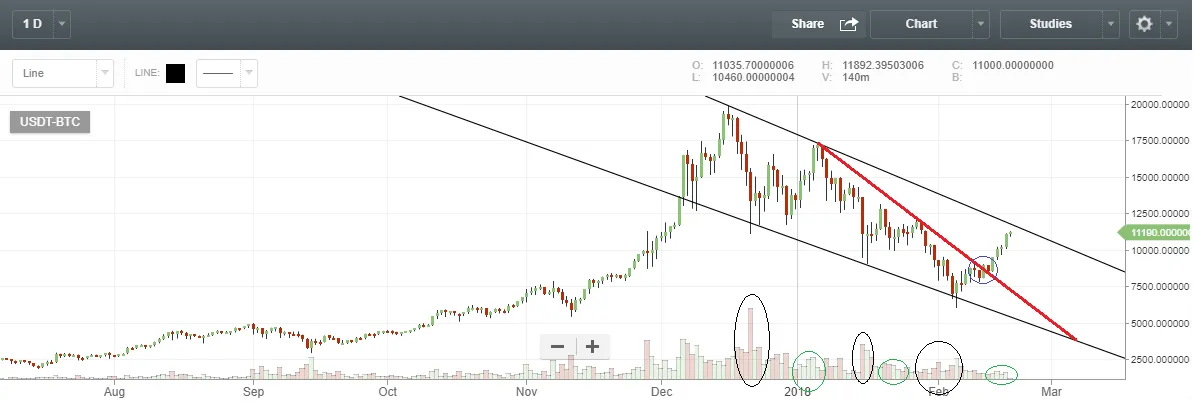
This is the price chart for bitcoin since July of last year. Each red or green "candle" represents a single day.
Bitcoin and the cryptocurrency market in general are in a very ambiguous place right now, from a technical perspective, but this is probably a make-or-break moment for the short term.
As you can clearly see, bitcoin peaked in December at almost $20k per coin, and then fell precipitously and with great volatility all the way down to $6k per coin. Since then, prices have almost doubled again to 11.19k, almost straight up.
The first two peaks of a decline typically establish a "resistance" line whose downward slope acts as a ceiling for prices until the decline is over. If we extend that resistance line out, we see that it puts its price ceiling today just above where prices have climbed. There is an especially strong possibility of a reversal back into price collapse when it hits that line. However, it breaks past that line and holds for a day, then there is an especially strong possibility for prices to start another crazy rally for which bitcoin is famous.
Bulls (optimists) argue that the real resistance line was the red one starting from the peak in January, and if you use that as your trend channel, then you can see that BTC clearly broke out of it several days ago. They further their argument with real world news, citing a conclusion to the panic about government regulations, the magnitude of the collapse from 20k to 6k and consequent interest from professional investors, and various big, positive news items expected in the coming weeks and months related to software upgrades for the major coins that should improve speed lower costs of transactions, finally rivaling or surpassing credit cards.
Bears (pessimists) like me are concerned that this recovery is a bull trap along the wider channel of descent bounded by the black lines I've drawn. It is definitely possible that we'll see prices fly away again like crazy, but my personal opinion is that the most likely case is that prices will rise a bit more, perhaps spike eye-poppingly for a moment, and then return to major collapse, down as low as 5k per coin. 3k is even worth mentioning still as a possibility.
In addition to the trend lines I'm seeing, I also would like to call your attention to the volume bars at the bottom. Observe how we've had roughly three cycles of boom and bust in this down trend, and each time, the volume has been much higher on the descent than the ascent. The pattern of price and volume has not changed; we are seeing a rapid price explosion on relatively very low trading volume, for a third time. The previous two times this occurred in this trend, prices collapsed once they reached the resistance line. Prices are a few hundred dollars below the resistance line again.
I will probably be selling many of my positions at around $11.4k per BTC (but my lack of confidence in this assessment means I'll hold some, as well).
What do you all think?