Hi Steemians.
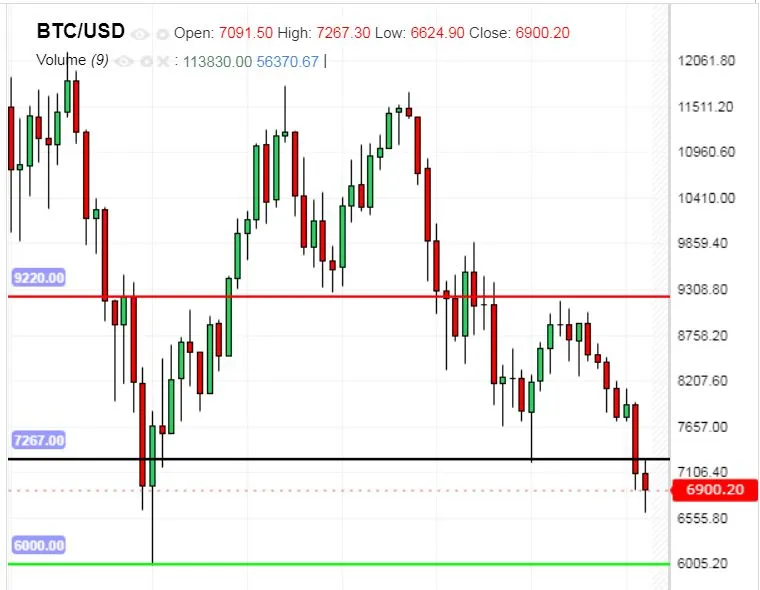
Bitcoin is trading @ 6900 $ and the price is sliding slowly downwards. In the picture above it can be seen that the next support area is at 6000 level Buying can be done only above the level and 7267 is acting as current resistance area. If daily candle closes above 7267 level the price is more likely to hit resistance @ 9220.
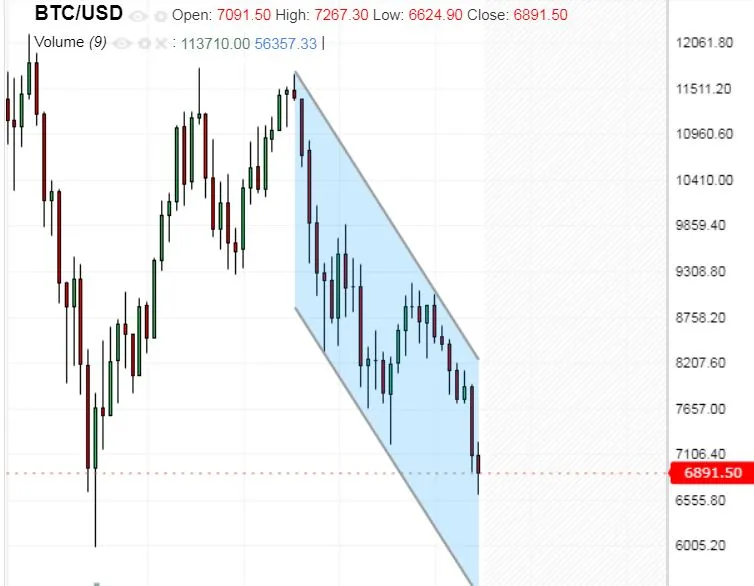
Another screenshot of the daily chart with the downtrend channel and market is trading inside it. Again 6000 level is acting as support zone and buying can be done above this level.
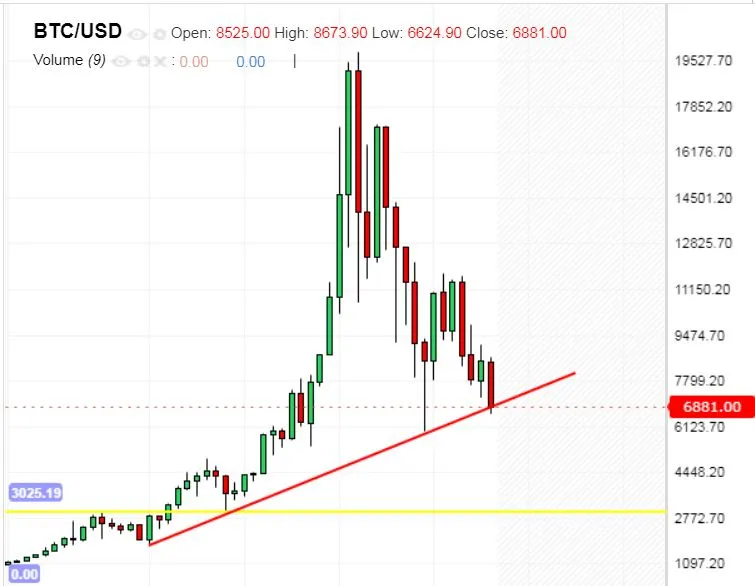
The weekly chart posted above shows a red trendline which is being tested by the market. The timeframe is larger to analyse but current candle is testing the key support level and will decide the next move if market closes above this level or shows a clear bounce then it's a buy option otherwise if market stays below the red trendline then 6000 is the zone to watch for bounce.
Hence, If you want to enter market then buying above 6000$ level is suggested and below this level their is no support expect the 3025 level as shown in the above screen shot, the yellow line.
Buying below 6000 is not safe, Don't try to catch the falling knife.
This post is based on technical analysis and it's not a trading advice.
Thanks for Reading