Here are a few chart pictures of the past years in times of a bear market.
Hier ein paar Chartbilder der vergangenen Jahre in Zeiten eines Bärenmarktes.
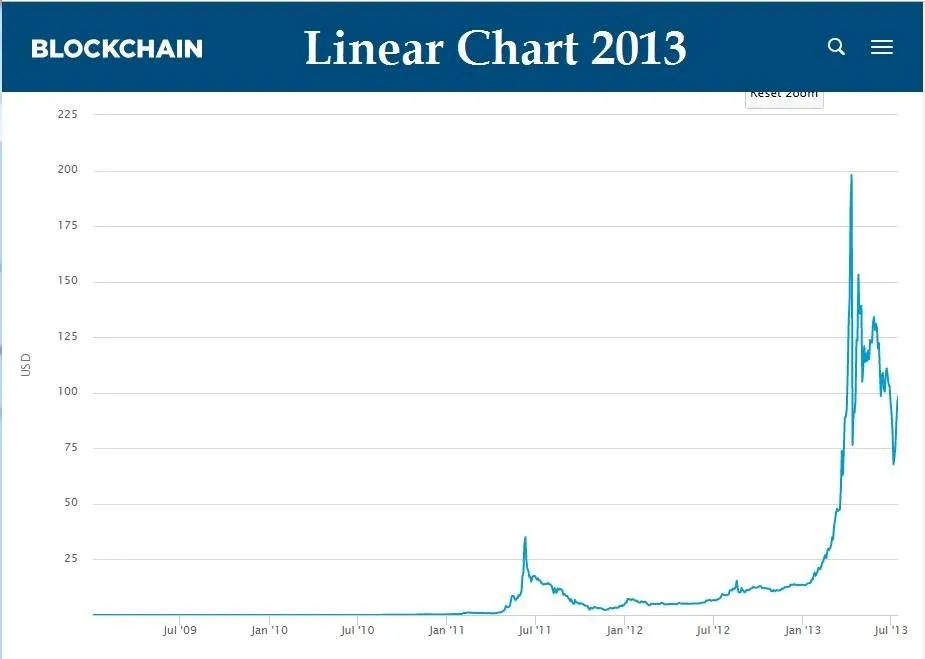
Linear Bitcoin Chart 2013
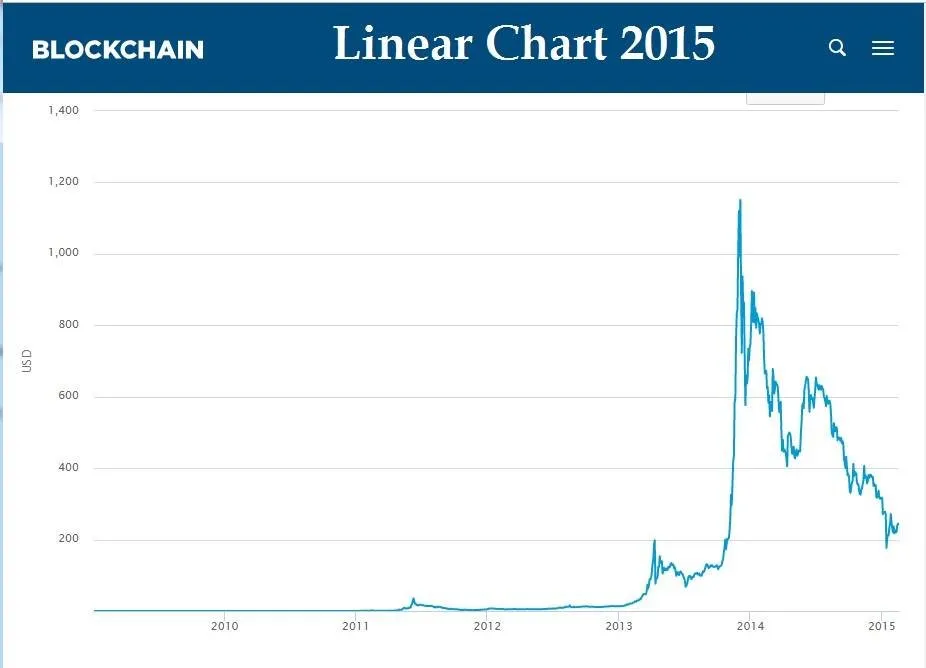
Linear Bitcoin Chart 2015
Linear Bitcoin Chart 2019

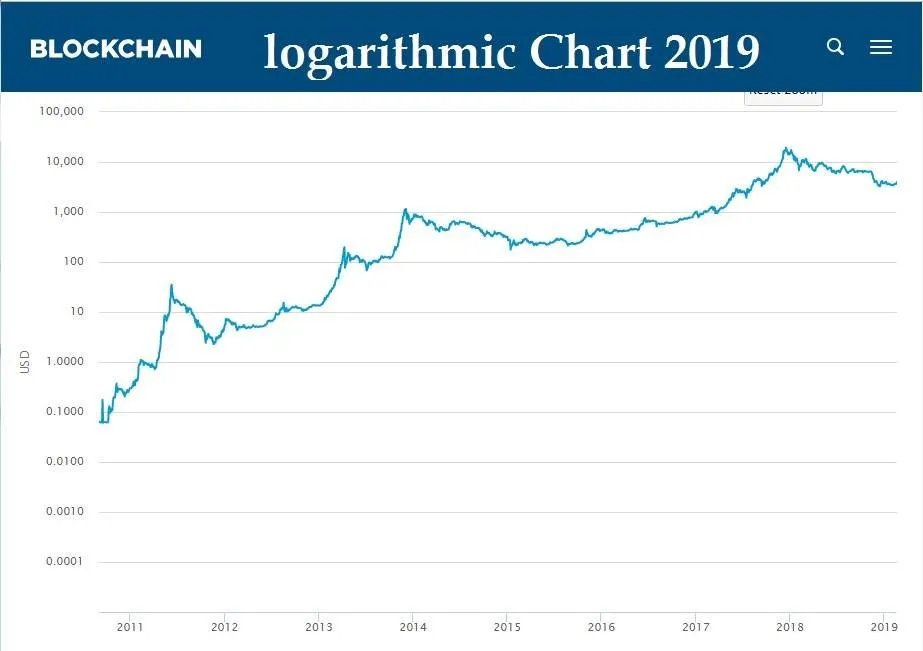
Logarithmic Bitcoin Chart 2019
Quelle : https://www.blockchain.com/de/charts/market-price