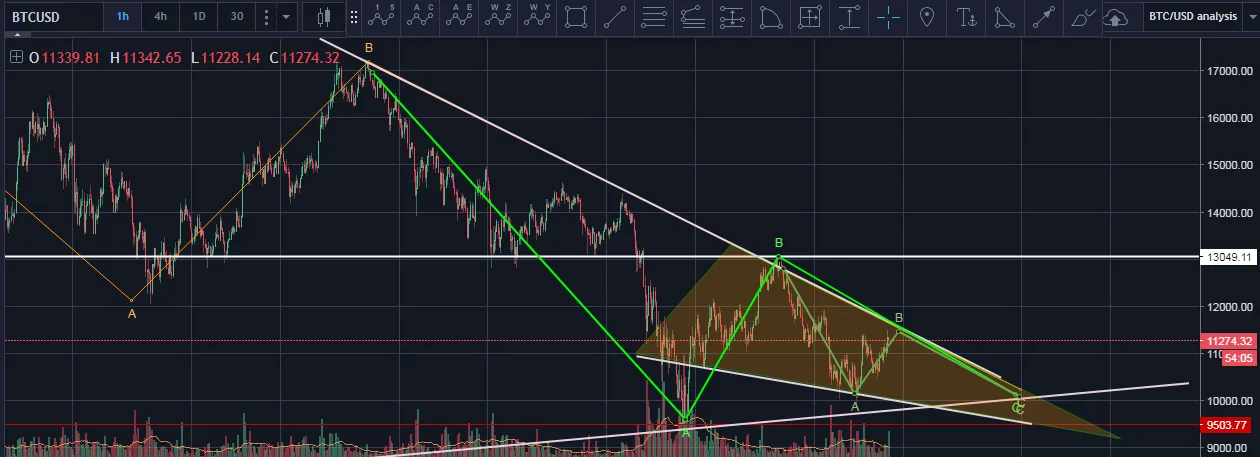
Back again for another BTC update. We're getting close to the BOOM! We can actually see a pretty nice falling wedge pattern emerge on multiple timeframes. This is how I think I've found the bottom :) If you look at the green Elliott waves, I've plotted where I think the price is 'wedging' to.
If we don't get a touch at the top, cool, but I'd like to see it coming down to the support exactly where my trend lines cross, as this would be the 3rd touch, which to me signals real support. Then we should get some volume coming in, and we're off!
I want to clarify that we aren't out of the woods yet. If we are yet to complete our C wave correction, we could be heading towards the support line again at around 10,1k which will act as the end of the downtrend and signal the start of an uptrend!
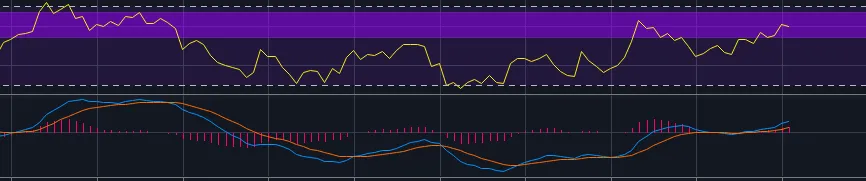
Look at the RSI! We are in a nice bullish territory, as you can see by the purple box I drew. This is my bullish zone. If we can stay in this bullish RSI we are all good. The MACD is turning slightly, histogram is levelling off and we have a pretty sexy crossover on the shorter time frame :)
Things are looking up for BTC, and we'll see some nice price action real soon. I'd guess sometime around the time of the futures contracts expiring, which matches up almost perfectly with my chart analysis :)
Hope you enjoyed guys!
Peace.
- B