Looking at the day chart above there are a few things that strike me right off. First and probably most subtle, there is a change in the way the charts are painting since the hedge funds started pouring money into this market. The volatility is, shall we say more orderly. It's funny, I have seen so many charts in the Forex and stock markets that I know just by glancing at most charts what is going on with the underlying. Is it going up or down, sideways? Where will it be in a week if 'A' happens? Or, if 'B' happens.....etc.
But these crypto markets seemed to follow their own unpredictable paths. I was always guessing and although practically everything I picked up tripled in price at the very least; I know this was NOT a 'normal' market. Or wasn't it?
You see, I can see patterns emerging in BTC's behavior that match 'normal' markets more closely already. So they are manipulated by big money. No DUH! My advantage is my experience in the other manipulated markets I mentioned above. I know the MO of these greedy bastards. Hey, don't get me wrong, if I had the resources they do, and the fiduciary responsibilities they have; and I COULD, you'd better believe I surely would. It would be my job to extract as much money from any and all markets I am in for my clients LEGALLY that I could.
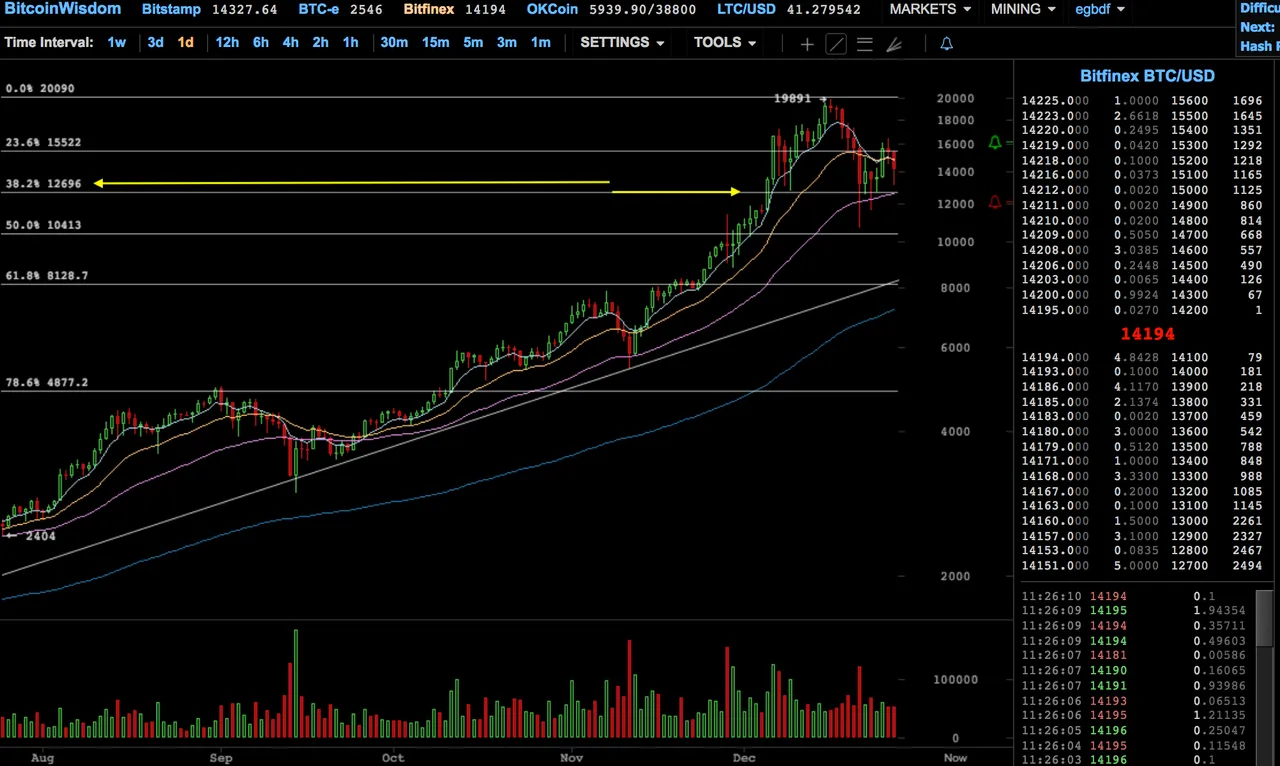
The beauty of it is I have been in both worlds for a long time now and I see the crypto world being manipulated just like the real world now more and more....and I know their game! Notice on the day chart above how we are testing the 38.2 Fibonacci. It's hard to describe, but experience tells me that the orderliness of this move through time is proof of my theory here.
Before the hedge funds moved big pullbacks in cryptos could mean months of waiting for another move back up. Not happening now.
A spike down flash crash could come at any time. We had one recently - sort of - from the top at $19810.00. Now notice on the chart below, we have a channel forming. Also notice how the variance around that channel is very tight. This is because the market is expanding every day with new money. Any whale, or hedge fund trying to front run the price DOWN is being stopped from doing it almost immediately by new money.
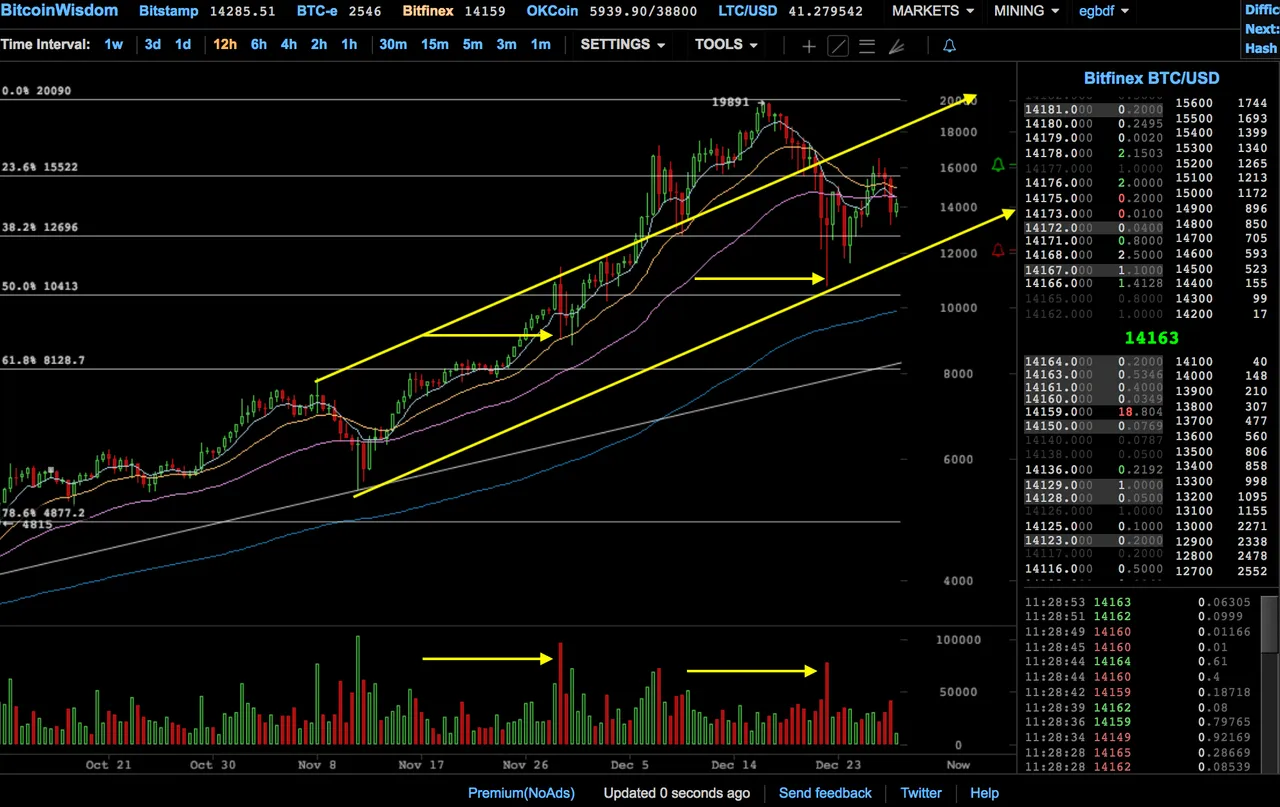
This attempted front running from the whales is illustrated by the volume spikes on the big down periods. You can see them marked by the arrows on the 12 hour chart below. The moves, although pretty brutal are becomeing more and more tame as the total market expands. These big money 'manipulations' are a good thing. The markets are starting to act more like normal markets, and the hedging going on acts as a buffer for volatility....this is all good stuff...
WHY?....because things are getting more predictable.
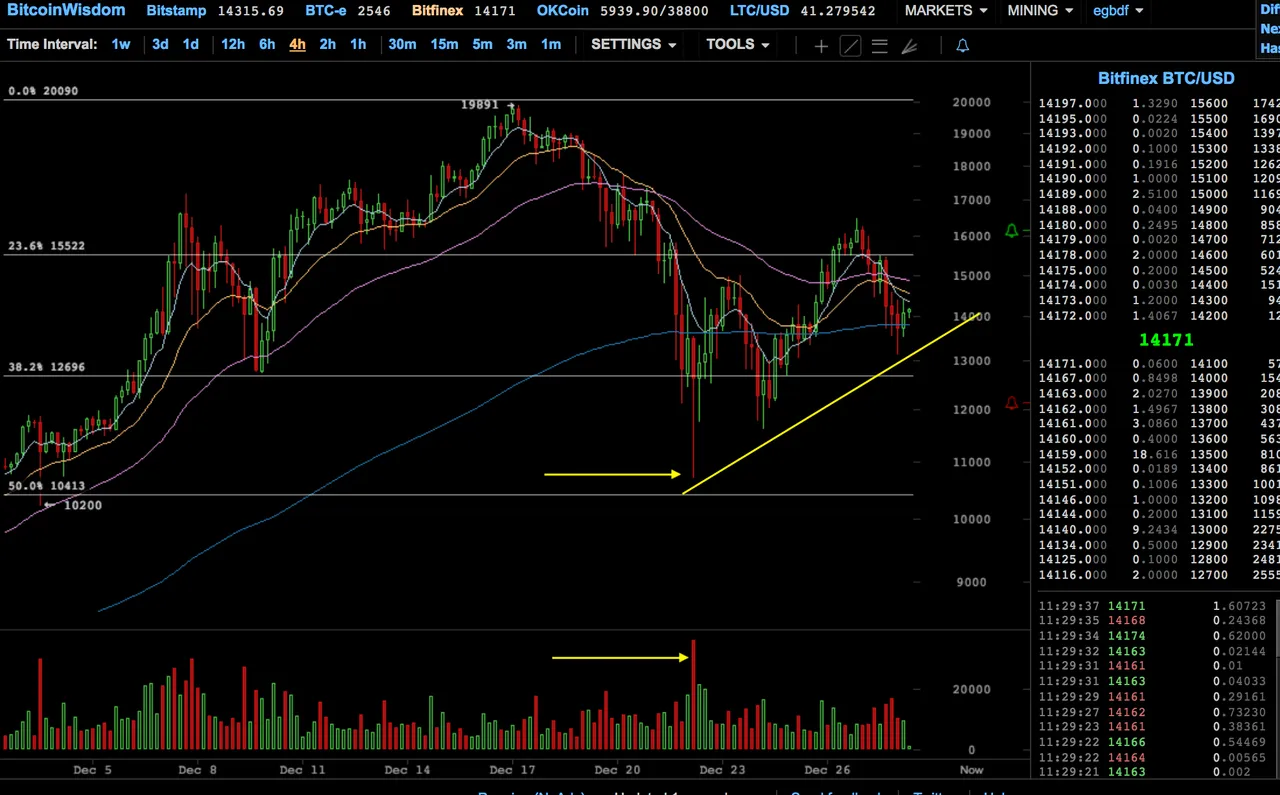
This 4 hour chart gives a closer in view of the volume spike that put in the new bottom at about $12,000. See how we have tested that 38.2 mark 3 times? And now the newest bottom is above the 38.2....very bullish! At least to the top of the channel in the second chart on this page. This is somewhere around $20,000.00. So if I were a trading type of investor, I would go long here with a stop loss around $12,700.00, target price of $19,850. We are at $13,750 right now so you would be risking about $1000.00 to potentially make $7,000.00 on each bitcoin traded. This is a KILLER risk to reward proposition.
This 1 hour chart shows you again the spike in volume before the move back up. BIG Money is battling it out in the war of price discovery. Very interesting stuff.
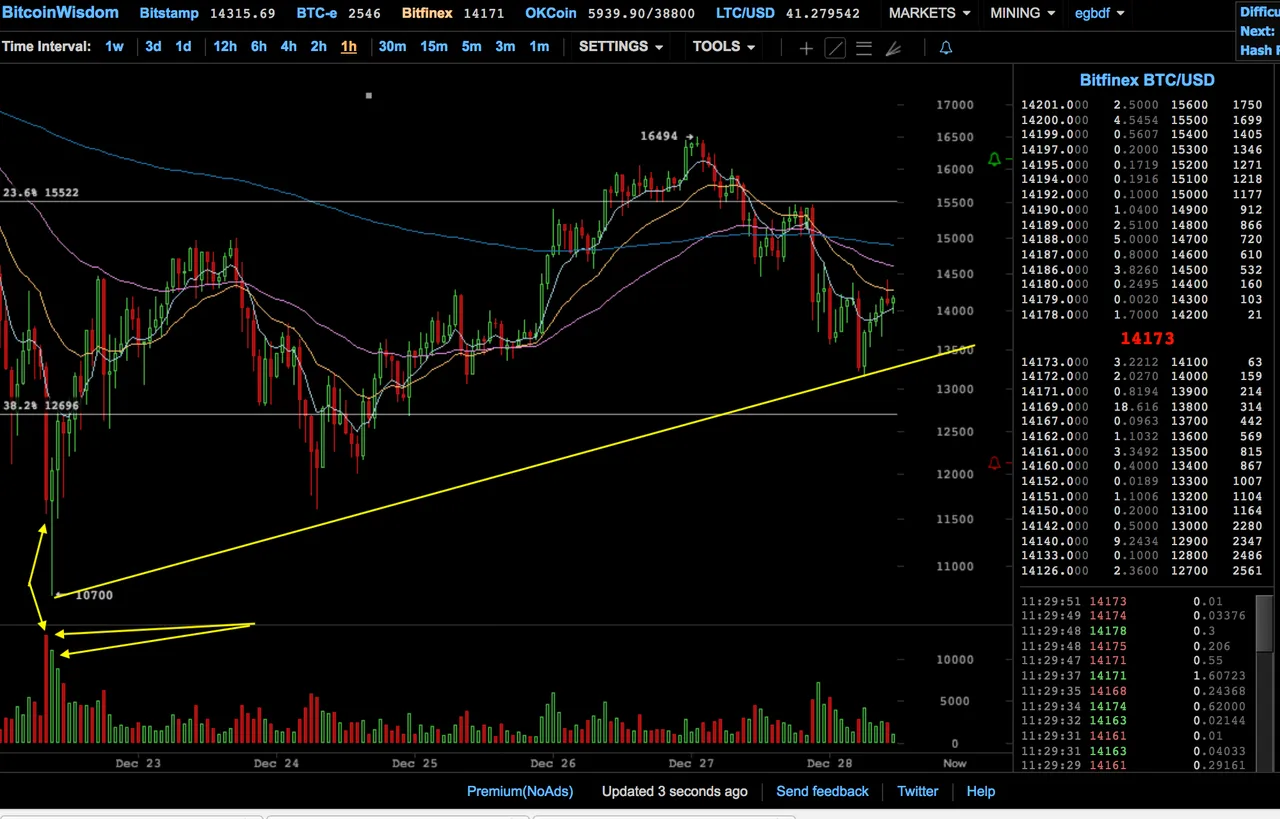
This last chart is just an expanded time-frame zoom-out of the 1 hour chart that shows the 'flash crash' to $10,700.00 quite nicely. Look at the bottoming tail on the second hour of the flash crash. They pushed the price all the way down to the end of that tail before the bulls went on a rampage and the price shot back up . Also, notice that the volume on the buy side outweighs the selling of the spike down....they are accumulating....you should be too!