There are little bit confusion and fear going on with the market. Is the market going high or going low, upward or downward trend will follow? To answer these questions I always use to analyze the previous data, current chart pattern, current volume. Including them, I like to use some indicators to forecast the price movement like ADX and MACD. Take a look what they are indicating now.
ADX Indicator
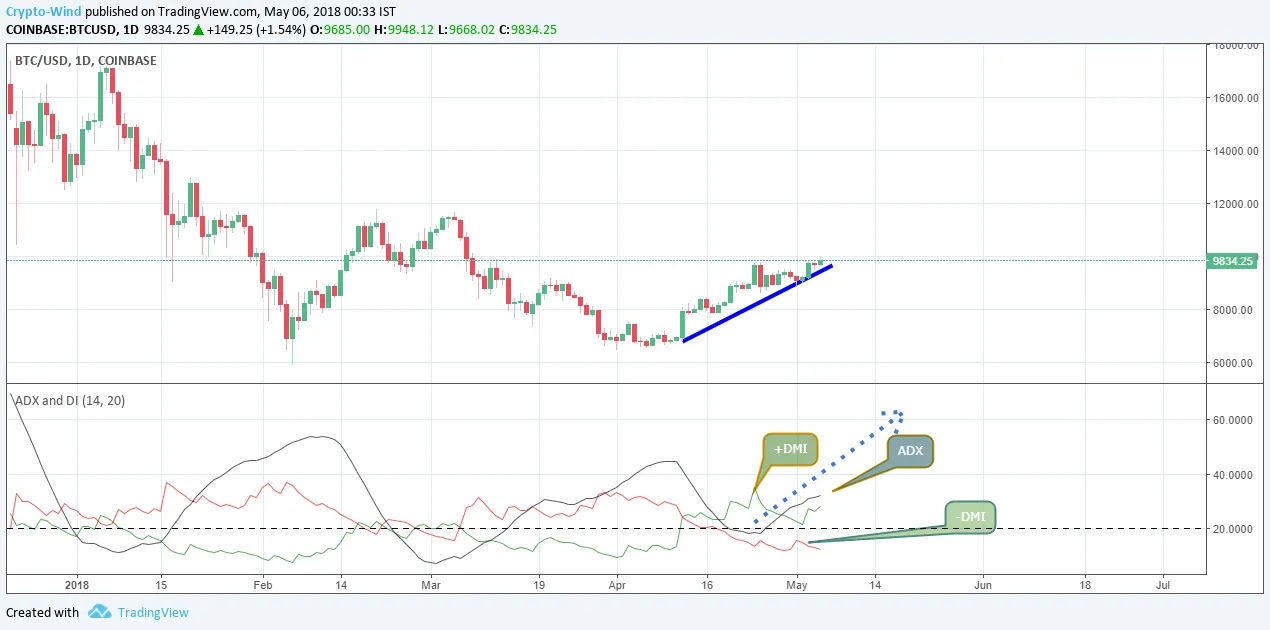
The ADX indicator is a great way to determine when a price is trending. The +DMI is above the -DMI, it means prices are moving up.ADX is more than 25 and the actual value is 31, i.e. slightly strong uptrend is showing.
MACD Indicator
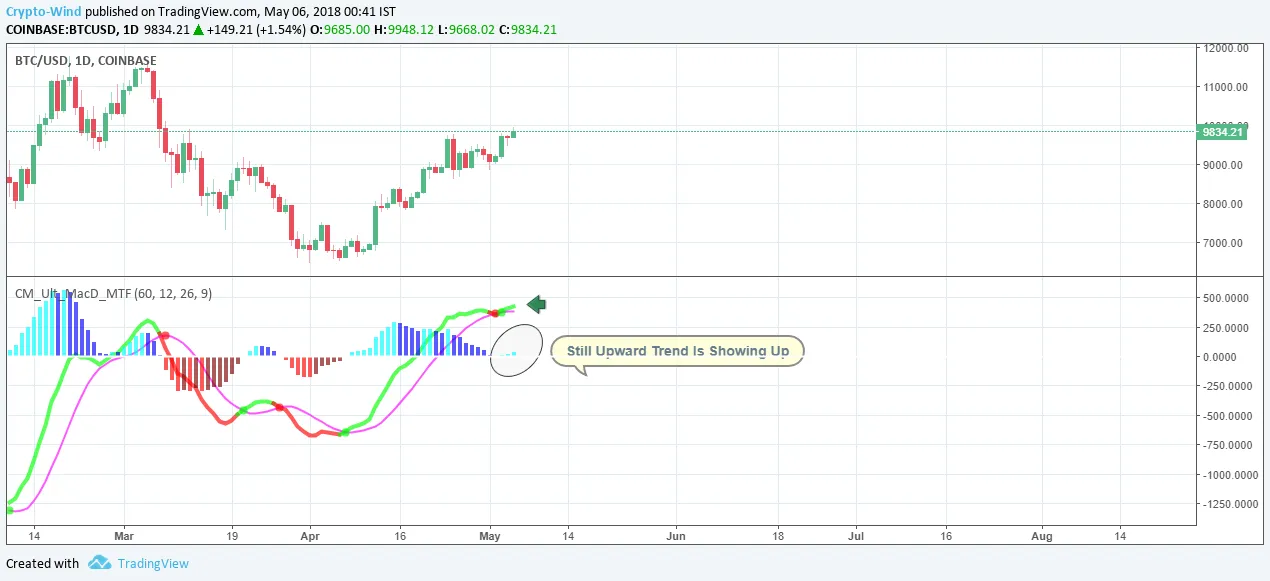
As shown in the chart above where I used one-day time frame, the MACD rises above the signal line, i.e. the indicator is giving a bullish signal, which suggests that the price of bitcoin is likely to experience upward momentum. Divergence or a dramatic rise have not been found.
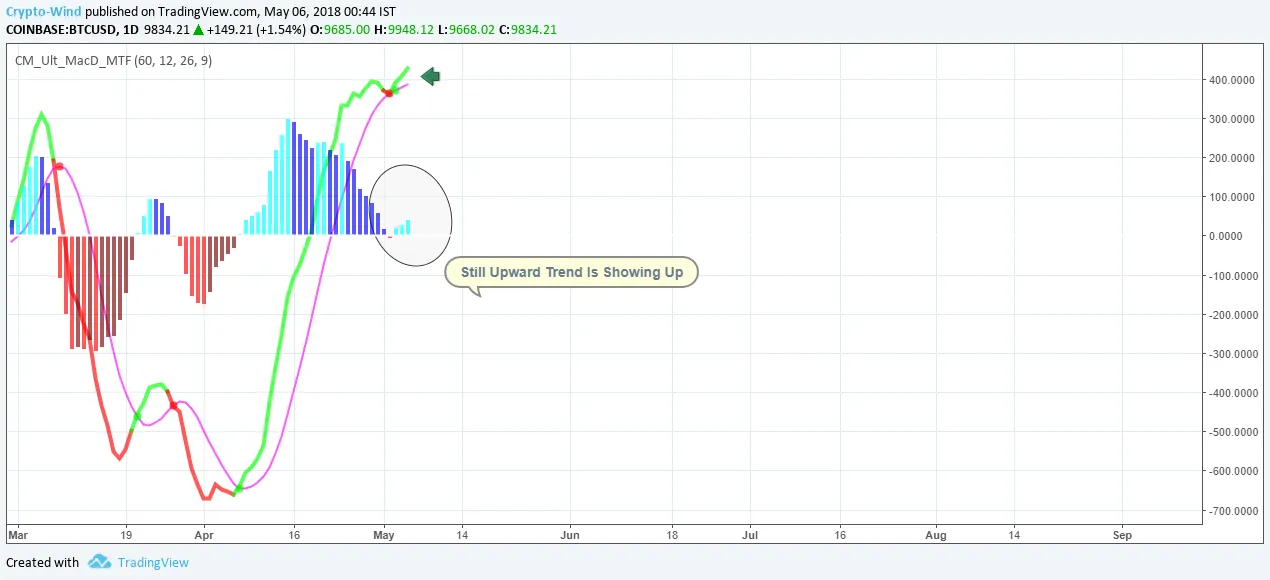
Take a more intense look on it.
Summary: A bullish upward trend is expected within three days!
You can also check my previous idea Bitcoin Is Going To Hit 10.5k$ or More Within Two Weeks
Disclaimer:Everything written here is for discussion purpose only and should not be taken as advice to invest your capital.Always Speak with a professional financial planner or advisor before making any investment decision.Never make a trade based on what you see here.Your capital may be at risk in cryptocurrency trading.