BTC has finally broke out of the falling wedge and continues surge toward 11k and probably further. ATM price is fluctuating in a rising wedge (bearish pattern) which should fall from it at some point, which is most likely once it hits the trend line, especially considering that BTC is already reaching overbought levels on most of the indicators and time frames. The Bounce will indicate completion of wave 3 and beginning of wave 4 toward 9800-9200 levels 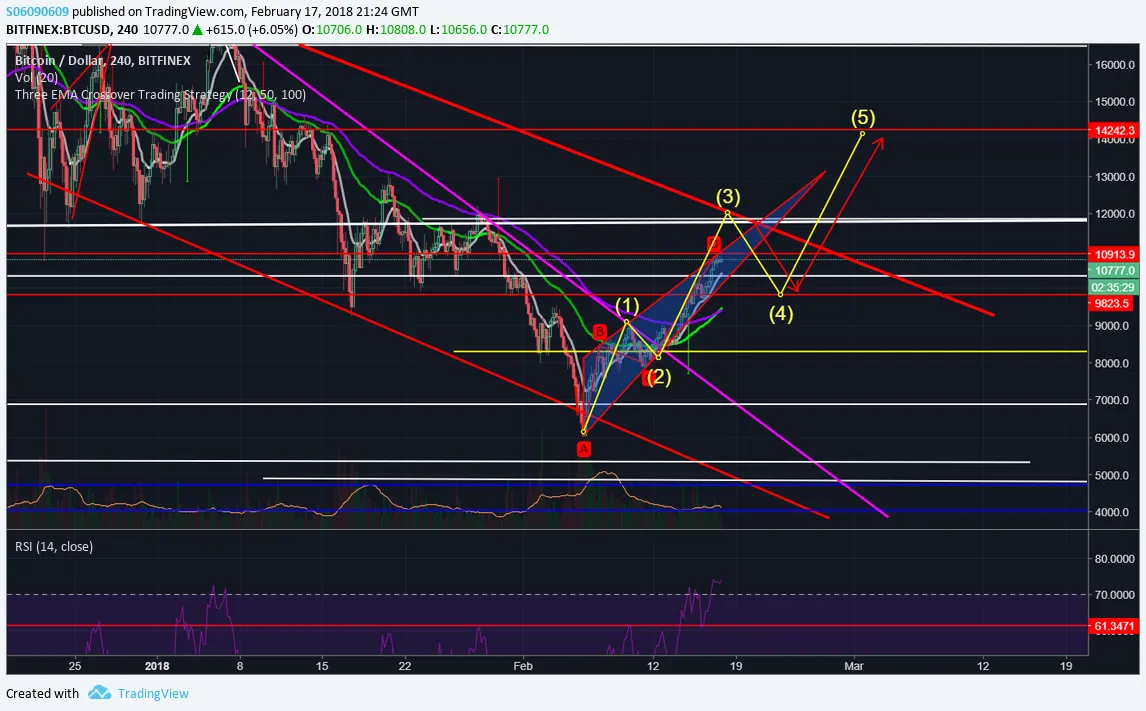
Depending on the length and volume of wave 4 it may create an inverse Head and Shoulders which will create a supper strong setup for further uptrend. 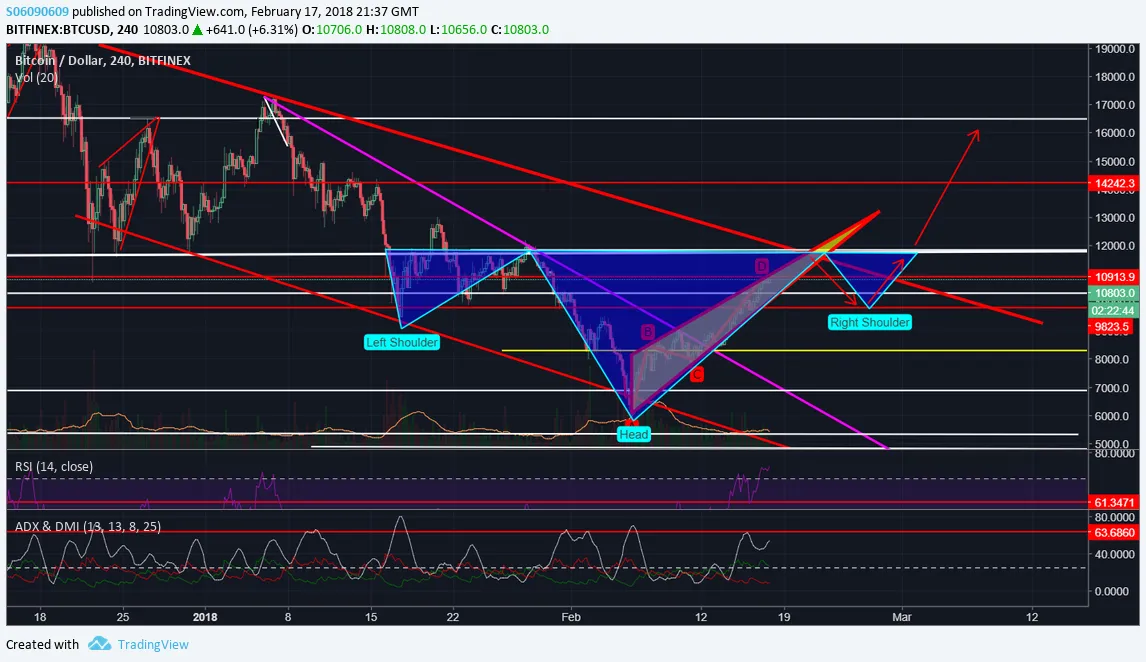
On a smaller scale price is completing wave 4 and setting up mini ascending triangle for a final push to the trend line, at which point the price is likely to go down to setup a breakout of the trend line. 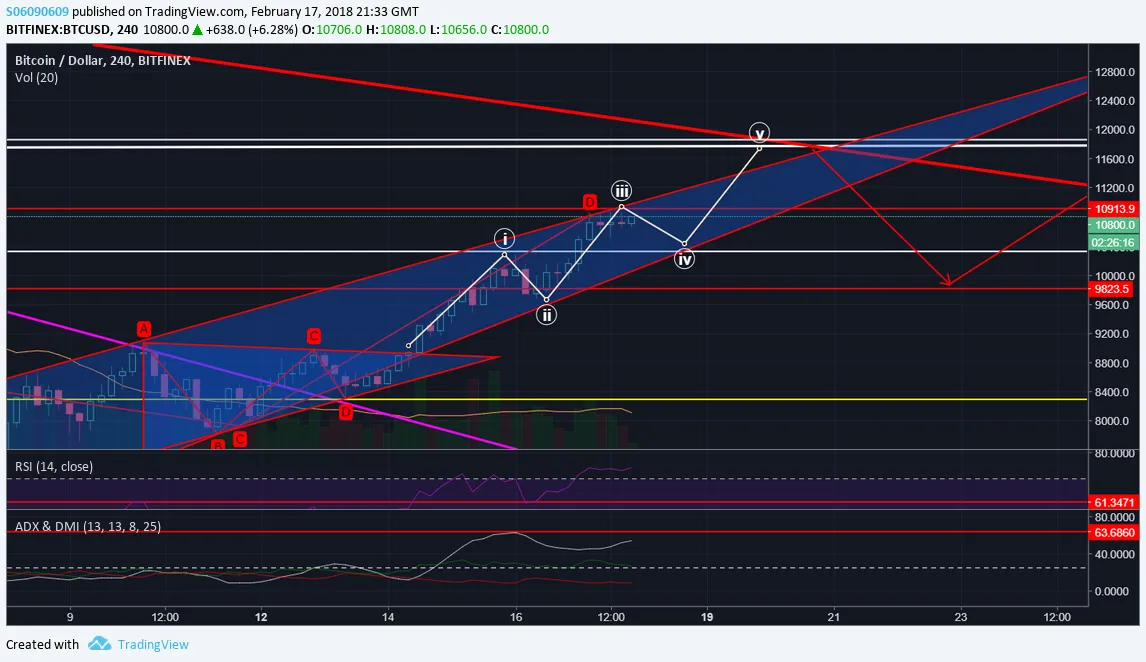
Counterargument: Although Indicators are very positive right now, one does not simply ignore trend-line, keep an eye on the price behaviour around it and what patterns are developing underneath it to see what are potential options. There is no guarantee that the trendline will be broken even with all positive indicators, and we may well see strong bounce of the trend-line and further downtrend.
Always Use Stop Losses!
Twitter: https://twitter.com/DRyabich