http://www.cryptotradingmastery.com/
*** please RESTEEM and VOTEUP if you like this post.
Happy to see our Cryptotrading Community growing we now exceed 100 and growing fast. THANK YOU. Please feel free to just let loose and comment, share your views and opinions. Lets hear it
*** REMEMBER IN MY ANALYSIS I AM TELLING YOU ALL OF THIS IN ADVANCE.
THIS IS NOT HINDSIGHT TRADING THAT MANY SO CALLED "GURUS" ARE PRONE TO REUSE***

In today's analysis, I am forecasting a Bitcoin Price Crash to around $1,650-$1,700 - a drop of 1/3rd of its current price! The current Bitcoin price, at the time of this writing on 10th July 2017, is $2,509.
PLEASE WATCH VIDEO BELOW:

Before I start, it is responsible of me to remind you all that as professional traders we ALWAYS ALWAYS ALWAYS use STOP LOSSES. There is no right or wrong in trading. To make money in trading it is ONLY about being in RHYTHM with the market. If you ARE in rhythm great, ride it and milk as much profits as you can before cashing in. If you're OUT OF SYNC with the market, you will have pre-defined your risk BEFORE placing the trade and your stop loss is there to protect you losing a big chunk of your capital. So the question you must ask is is my account growing or not - that is the ONLY right or wrong, any one trade is insignificant.
Ok, so now we have the right mindset (mindset is critical), we can look objectively at the argument for an impending Bitcoin Price Crash. A key factor which I think may cause this a fall is that the miners may not reach agreement on 1st August 2017 as to upscaling the blocksize for Bitcoin.
Let's look at the analysis.
Firstly, we have a trendline which has been following the upward ascent of Bitcoin. At some point this trendline will break, if it does i'm looking to for a short trade setup. Let me explain further my pre-planned trading strategy.
If you watch the video, I explain that we are looking for confirmation of a short entry on the taking out of the most recent minor low (on a daily chart) AND the breaking of the trendline. Our stop wil be placed above the most recent high. Good, we now have done the most important part and have our risk pre-defined:
To have a larger view of the chart, just right click on the chart image and select "View Image"
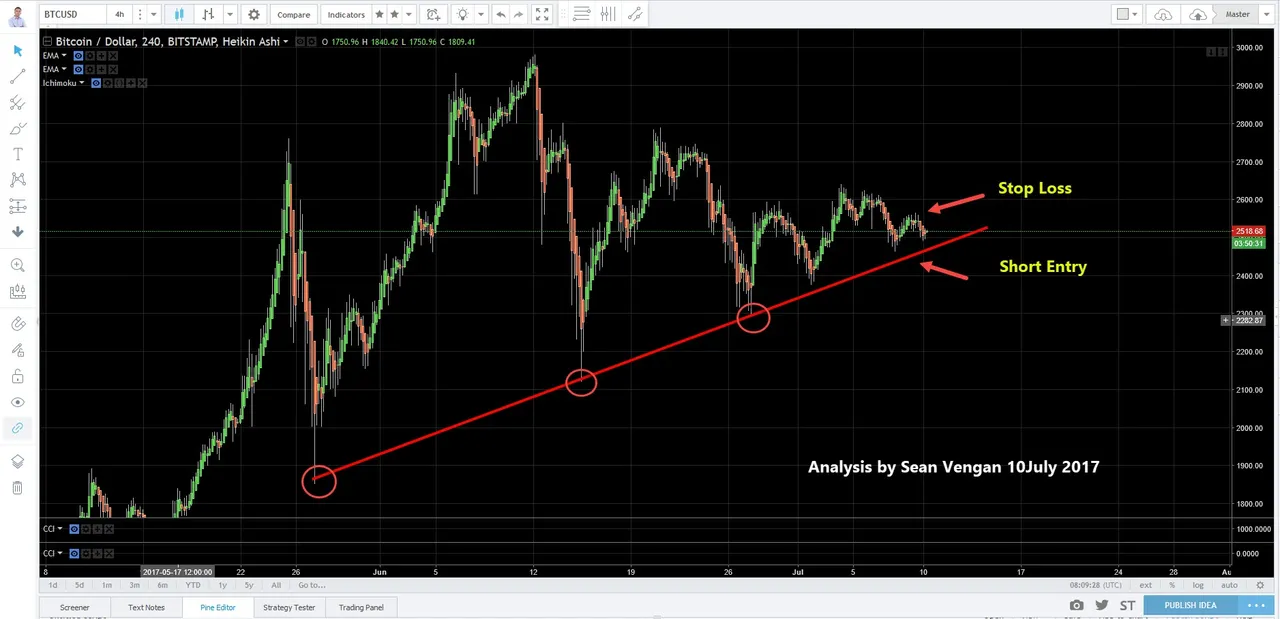
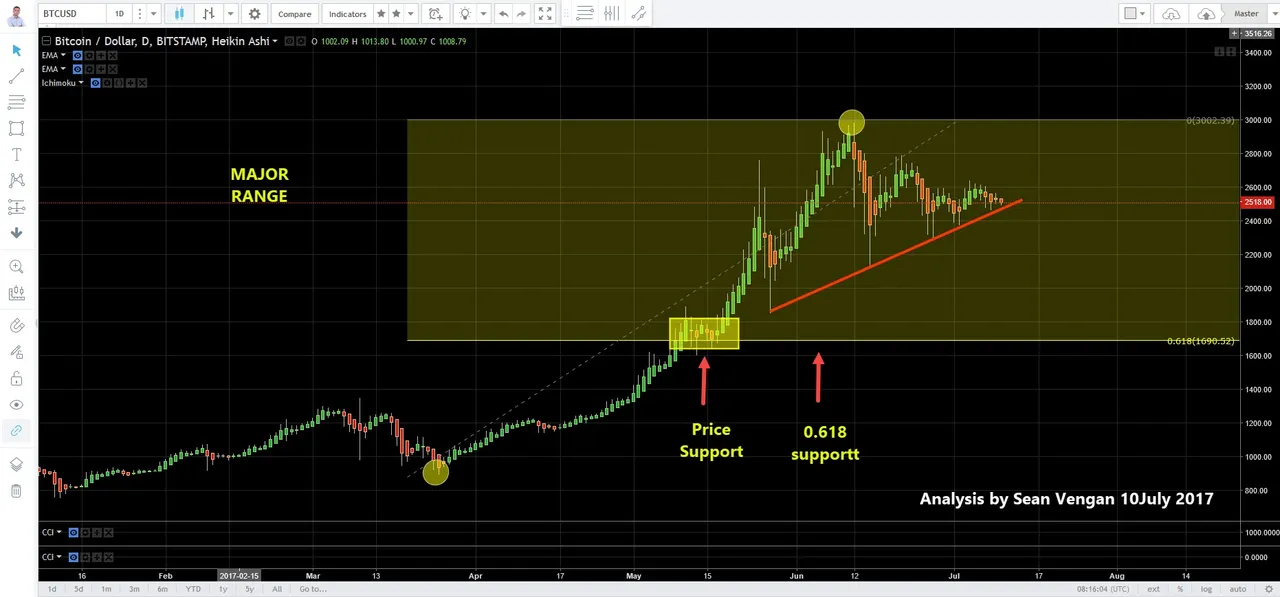
In terms of targets, lets look at previous lows and do some fibonacci work. Look left on the chart we see there is price action support at around the $1650 - 1,700 price, an area where buyers and sellers disagreed about price.
Next we use one of my favourite tools Fibonnaci.
Still using only the Daily chart, we look at the bigger picture and we notice the current "Bull Run" started at the Low (marked by a yellow circle on the Chart) which occured around Mar 2017. We measure this range and discover that the 61.8% of this range coincides with the price support around $1,700. the technique we used was price retracement.
To have a larger view of the chart, just right click on the chart image and select "View Image"
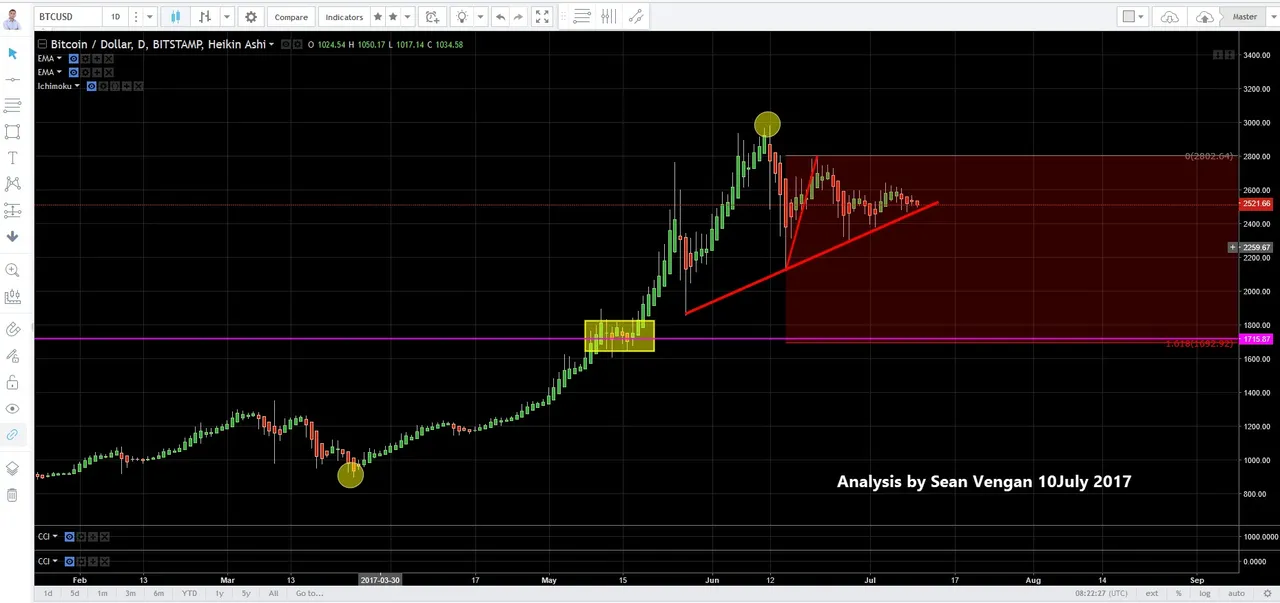
Our next tool in our toolbox is a price extension. Here we take a low and take a high (as shown on the chart an in this case project down). We get another hit at 1.618 around the price of $1,716.
To have a larger view of the chart, just right click on the chart image and select "View Image"
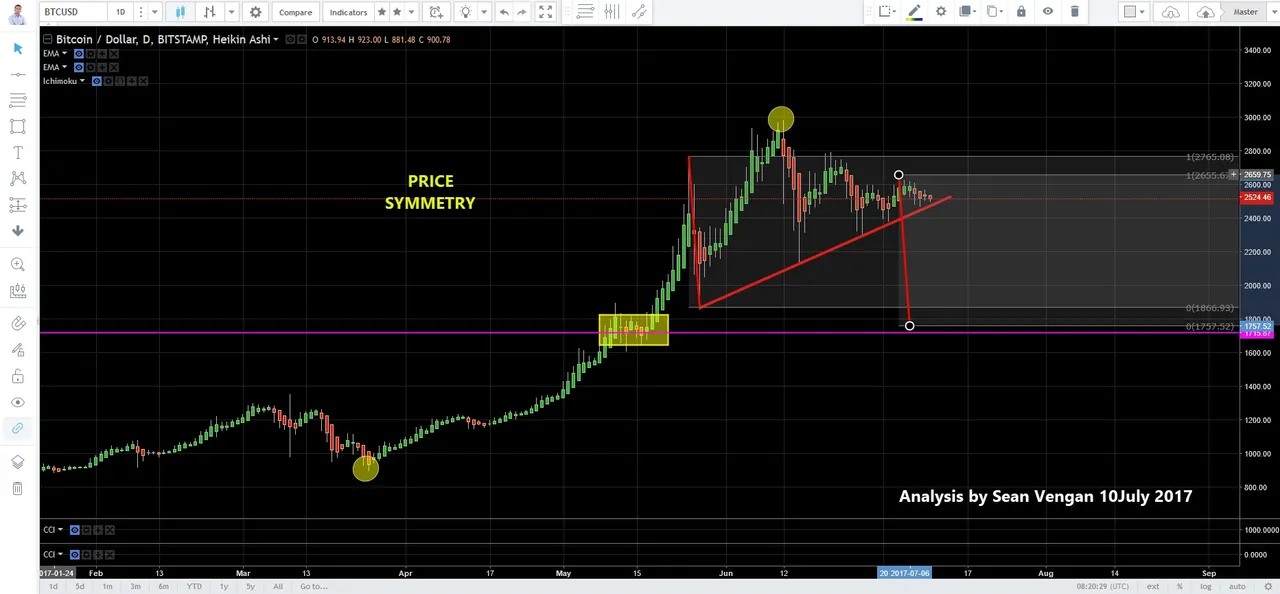
Finally, we use the next technique called price symmetry. Here we measure the prior major swings down (shown on the video). The idea is that our hindsight becomes our foresight as we project the same distance from our current near term top. Again, bulls eye on the $1,700 area.
To have a larger view of the chart, just right click on the chart image and select "View Image"
As always, I give you a RoadMap as a Trading Plan and I have marked entry, stop loss and three targets:
So we now have price action support, fibonacci confirmation and potential a trendline break all indicating for us to go short IF price moves in this direction a confirmation break of our trendline and breaking of lows gets us into this trade with low risk, high reward. We place our stop loss and sitback and let the trade play out. No anxiety attacks. No panic. Cool, calm and collected.
I see good support around $1,650 mark so we can look to book in our profits just before this level.
I am teaching you this as a result of my 10+ years of successfully trading experience in the markets, where I have seen human emotions react and it will never change, as long as we have financial markets - all of this I am sharing with you freely so you may plan your trades and stay calm and in control, whilst others around us are panicking.
*** REMEMBER I AM TELLING YOU ALL OF THIS IN ADVANCE ***
Hope this helps.
Please subscribe to my YouTube Channel and register your name on my website :
http://cryptotradingmastery.com/
https://www.youtube.com/playlist?list=PLn7YikUv2BchBGW8Gza0o6uOPAb3Sop9Z
If you like this post feel free to "Resteem"this post , "Voteup" and follow me at "https://steemit.com/@supertrader"
Sean Vengan, Cryptotrader and Trading Educator
Cryptotrading Mastery.com http://cryptotradingmastery.com/