I hope you followed the Bitcoin trends lately, because we could potentially reach for incredible new highs the couple of weeks.
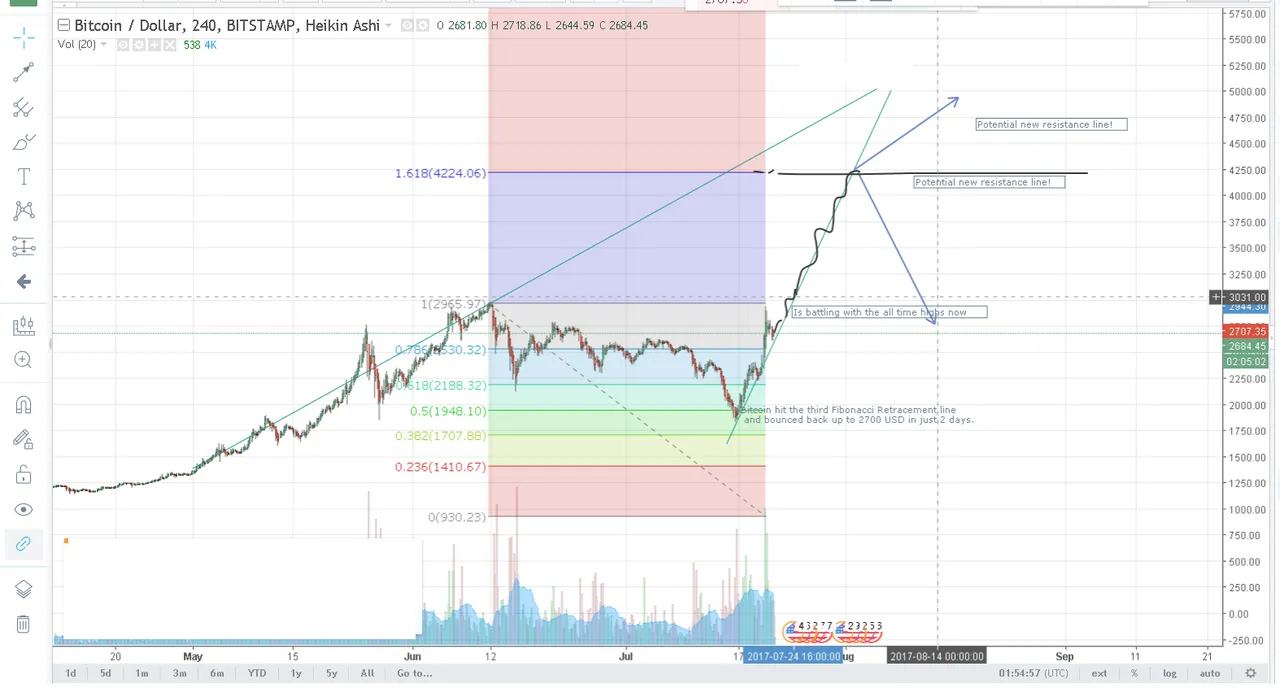
Bitcoin hit the third Fibonacci Retracement line*, which ment it went down to: $1800,- and bounced back up to 2700 USD in just 2 days.
The trading volumes remain insane even now the price is dropping a little bit, this means a incredibly Bullish trend.
Now BTC is battling with the all time high, set on June 8th 2017. After that, if we meet the first positive Fibonacci Retracement line BTC will battle with $4224,06!!
Tell me what you think!
- A Fibonacci retracement is a term used in technical analysis that refers to areas of support (price stops going lower) or resistance (price stops going higher). Fibonacci retracement levels use horizontal lines to indicate areas of support or resistance at the key Fibonacci levels before the trend continues in the original direction. These levels are created by drawing a trendline between the high and low and then dividing the vertical distance by the key Fibonacci ratios of 23.6%, 38.2%, 50%, 61.8% and 100%.