First, let me just start off with a disclaimer by saying that I am anything but a crypto coin market or technical analysis expert. I do enjoy attempting to recognize market patterns like the next amateur economist, and seeing others accurately and inaccurately attempt to do so can be entertaining if not educational. With that said, for fun and self-study I've recently been attempting to read and analyze bitcoin-usd trends, experimenting with the tradingview.com chart tools, and herein will share with you my latest charting attempts to recognize two possible bullish patterns forming on the one day and for hour time frames. Again, I am no expert and could have completely misread and made errors in charting these patterns, and even if the patterns appear to be accurate, anyone who is investing in the market must do so at their own risk knowing that past price action and TA patterns are no guarantees of success and that there is always a risk involved in investing in any market, especially the volatile cryptocurrency markets.
Moving on...The first example is seen on the one-day time scale over the last several months, when Bitcoin has experienced what seems to be a consolidation/ correction period after surging to its 2019 high of more than $13,000 heading into the summer. By drawing two trend lines of support and resistance it appears that the market could be forming a bullish flag, or alternatively it could even be a bullish pennant depending on which support line (red or orange) prevails assuming that one of them will. Judging from the relative strength index in this timeframe, it looks like the Bears are not yet exhausted so there is a probability that the price will continue to drop until it meets one of these support lines, which if confirmed could prove for an opportune swinglow entry point for long bets...
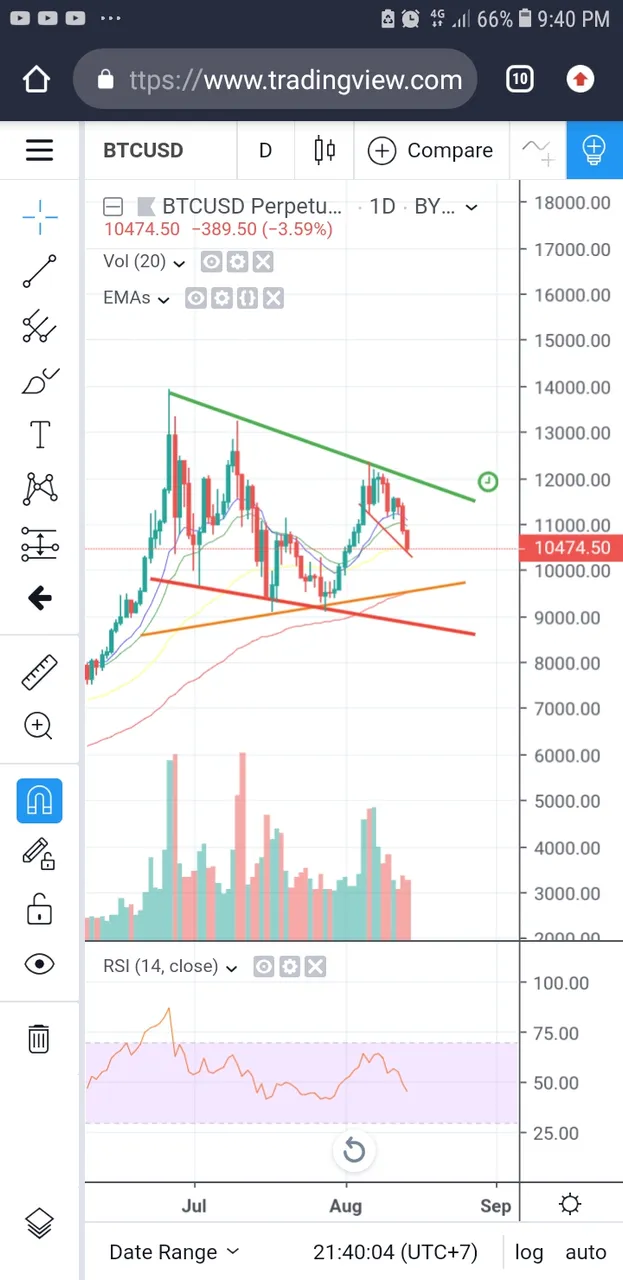
...or is it possible that we are about to see a reversal trend triggered sooner?
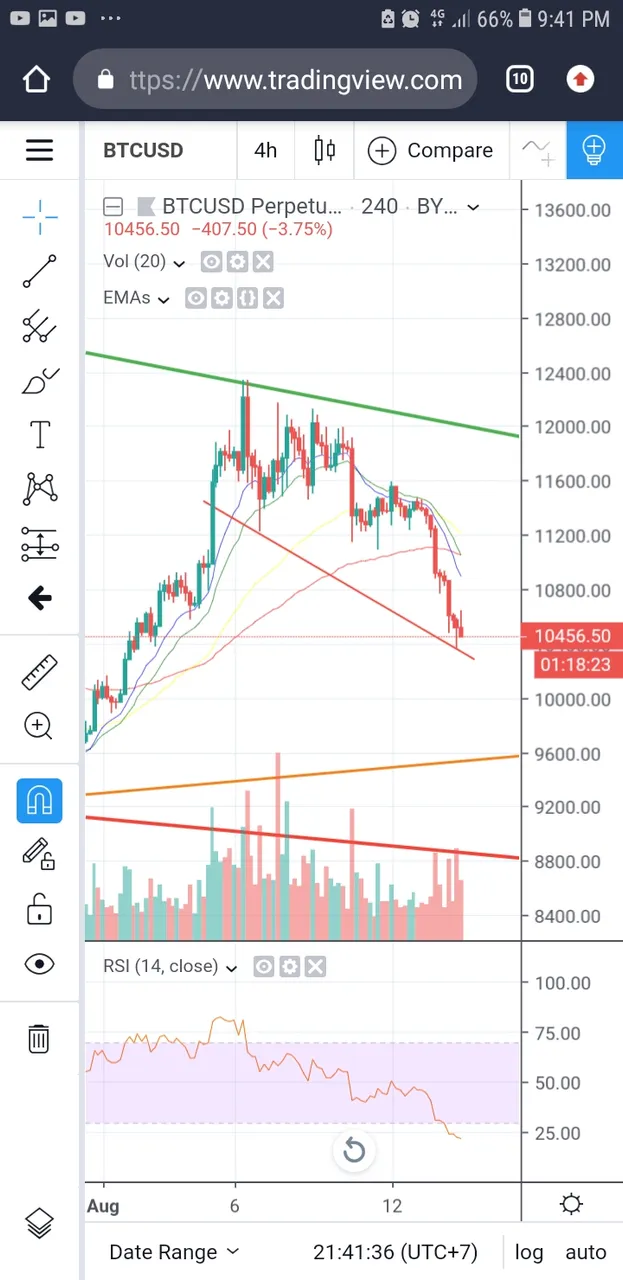
Zooming in on the most recent price action here in the second week of August, as the overall Market sentiment starts to get bearish following the latest sell-off here at the end of summer, the 4-Hour time frame, it looks like the market may be forming a descending broadening wedge pattern as shown by the two support and resistant trend lines. In this time frame, the RSI indicator seems to show that the market is oversold following the latest price action which could indicate a bounce up from this support back up to the top resistant line... if that proves to be the case and a breakout is confirmed the target could be an explosive one according to the rules for such patterns.
....of course I could be completely off and such patterns could be nothing more than random lines on a chart ...and with manipulation and arbitration possibilities this could all be a trap... as always, only time will tell and it won't be long before we know if I was even close to the mark..
In the meantime, I do welcome any comments or observations about the current trends with Bitcoin.