If you are a day trader looking for nifty trends during the day you need to have some tools in hand to use that. one of my fvaourite is bollinger bands study. Bollinger Bands provide a relative definition of high and low. By definition price is high at the upper band and low at the lower band you can include it in your chart and make quick decisions on the fly.
I did the following experiment in last 4 days with the btc i had. I started with 0.3 btc to play around.
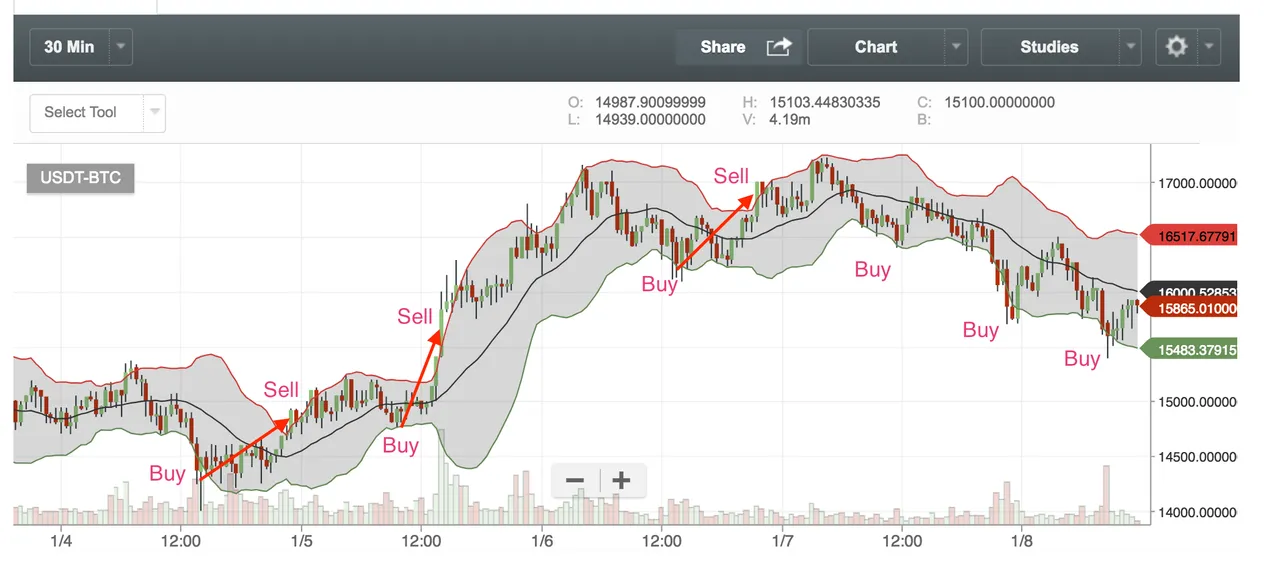
Trade 1 : Buy 0.1 BTC $14,300, Sell @ 14,870 Profit $50
Trade 2 : Buy 0.1 BTC $14,760, Sell @ 15,800 Profit $100
Trade 3 : Buy 0.1 BTC $16,100, Sell @ 16,980 Profit $70
Trade 4 : Buy 0.1 BTC $16,400, Sell @ -- Profit Pending
Trade 5 : Buy 0.1 BTC $15,700, Sell @ -- Profit Pending
Trade 6 : Buy 0.1 BTC $15,400, Sell @ -- Profit Pending
I only used 0.1 BTC per trade so that if it goes down i can buy more again. it went well for first 3 trades and i got a profit of $220 and then the next 3 trades i bought but never sold since the price has not reached the top levels. i hold the same btc as i had before but i now have $220 extra. I am new and learning myself, i was willing to lose as well as i read somewhere that trend following strategies lose most of the time. Yet they are still profitable in the long run. They key success factor is proper diversification and risk management. One needs to focus on diversification and risk. Not on the indicators and entry/exit rules.