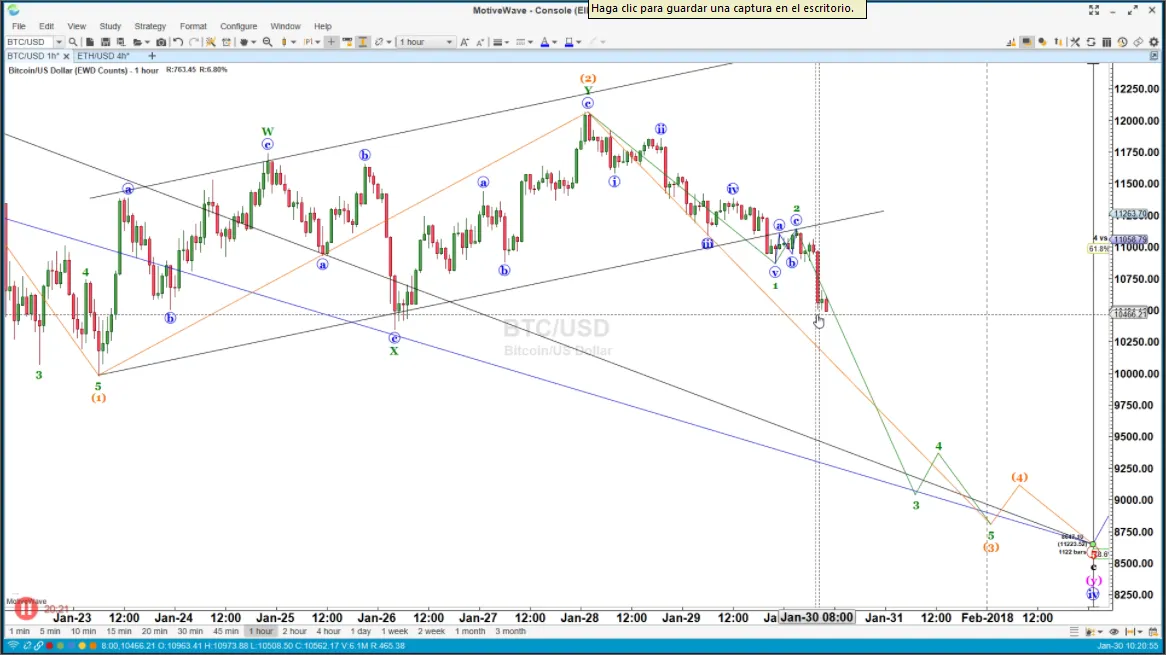
Este gráfico muestra la proyección del precion de bitcoin utilizando indicadores y análisis técnico.
Nos encontramos en una tendencia claramente bajista con un rompimiento de la linea de tendencia a niveles de 11.000 USD. Se proyecta que alcance niveles de 8.500 USD y luego en esos niveles se determirá un cambio de tendencia o continuación de la misma. Se emplea Elliot wave análisis y coincide con la media móvil de 200 períodos en marcos de tiempo diarios.
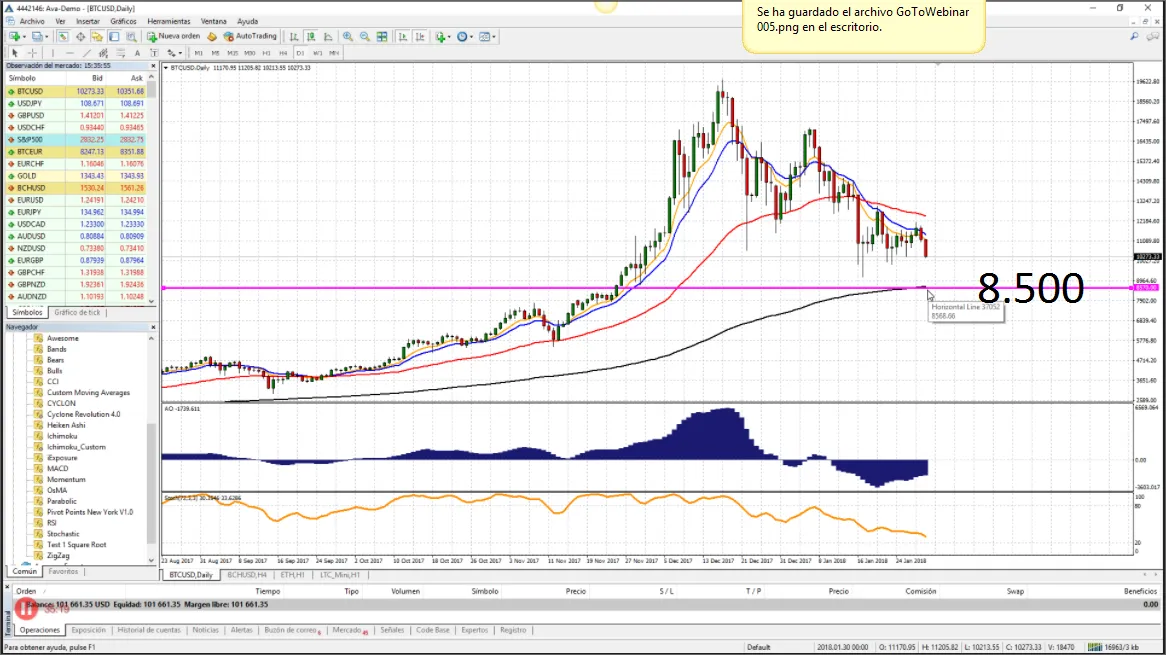
This graph shows the projection of the bitcoin price using indicators and technical analysis.
We are in a clearly bearish trend with a break of the trend line at levels of USD 11,000. It is expected to reach levels of USD 8,500 and then at those levels a change in trend or continuation thereof will be determined.
Elliot wave analysis is used and coincides with the moving average of 200 periods in daily frames of time.