Introduction
This is a short post consisting of some simple technical analysis for some of the top Cryptographic coins. I have not included any indicators, as I prefer to keep things simple and just use trend lines and Fibonacci retracement levels. Most of the charts are daily charts (one day represented by one candle) except for Bitcoin Cash which I have used the hourly chart due to limited data.
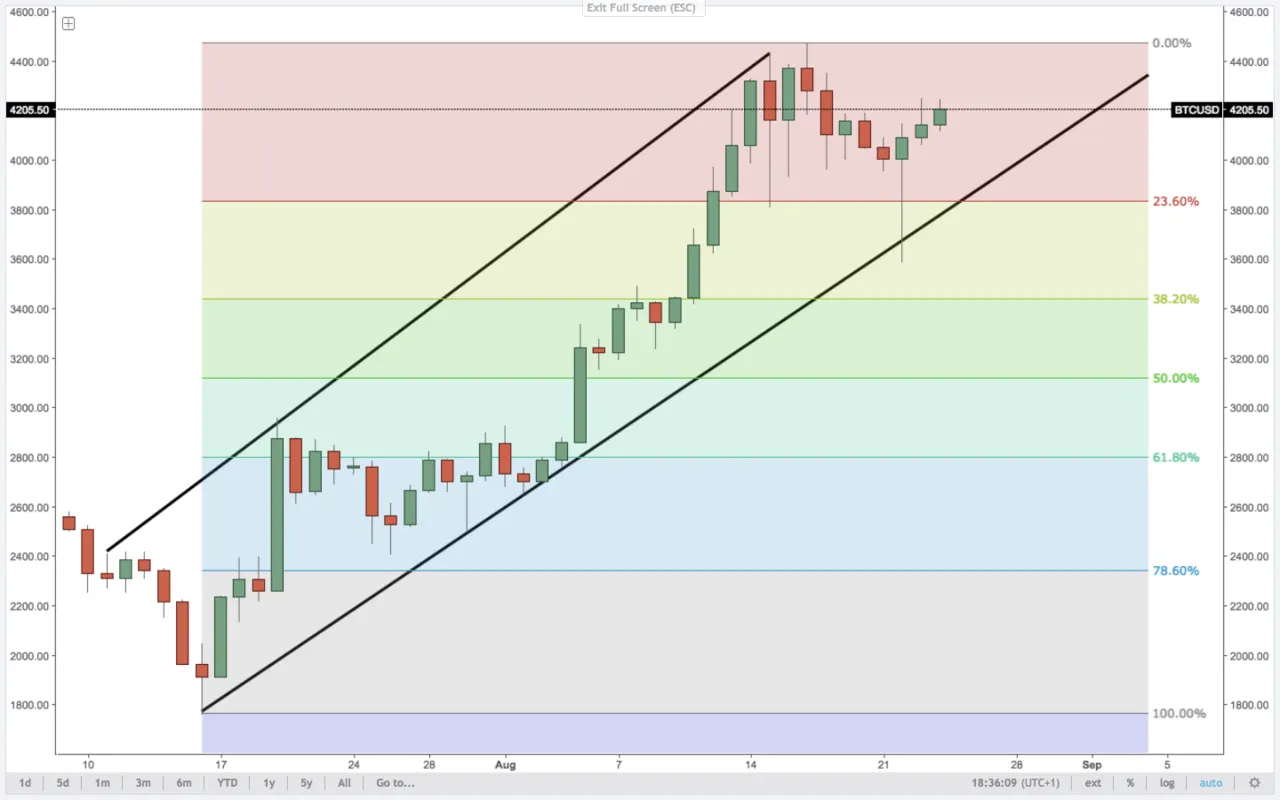
BTC/USD - Daily
Trend = Up
ETH/USD - Daily
Trend = Up

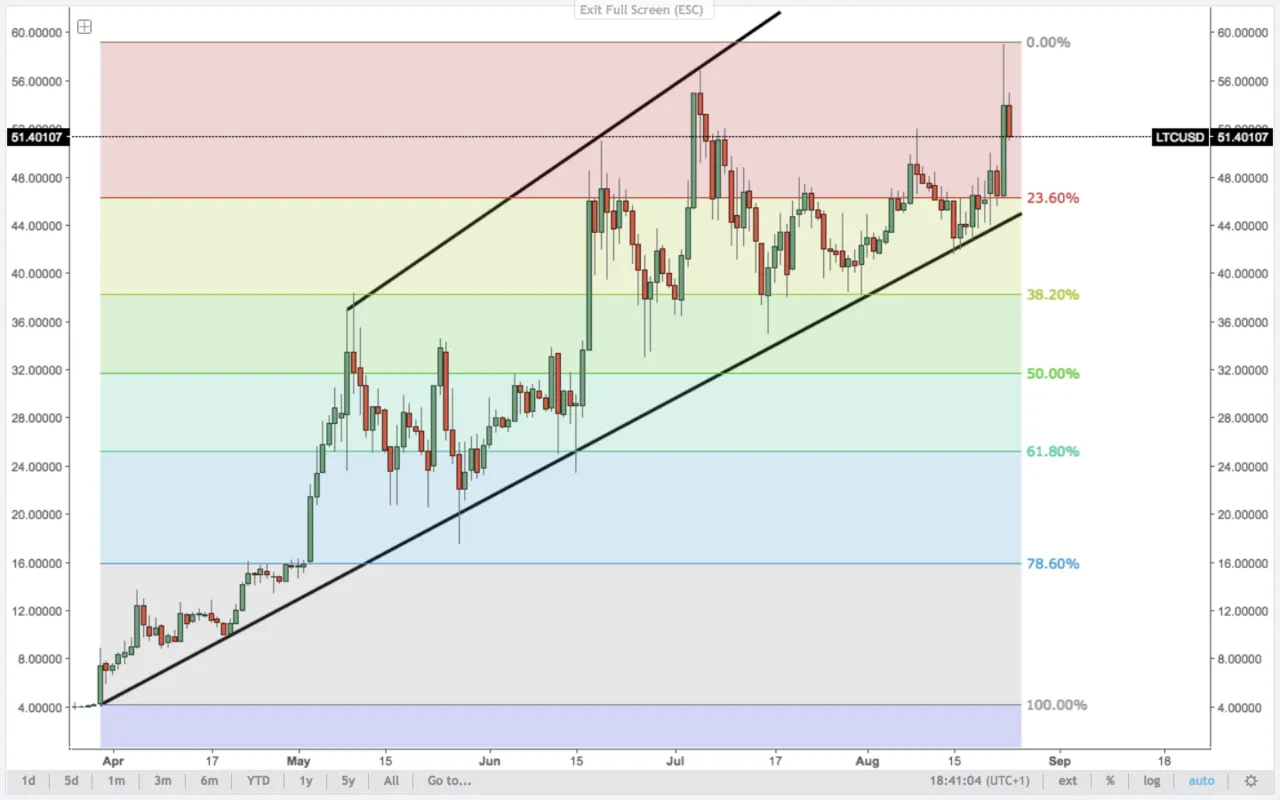
LTC/USD - Daily
Trend = Up to sideways
IOTA/USD - Daily
Trend = Sideways

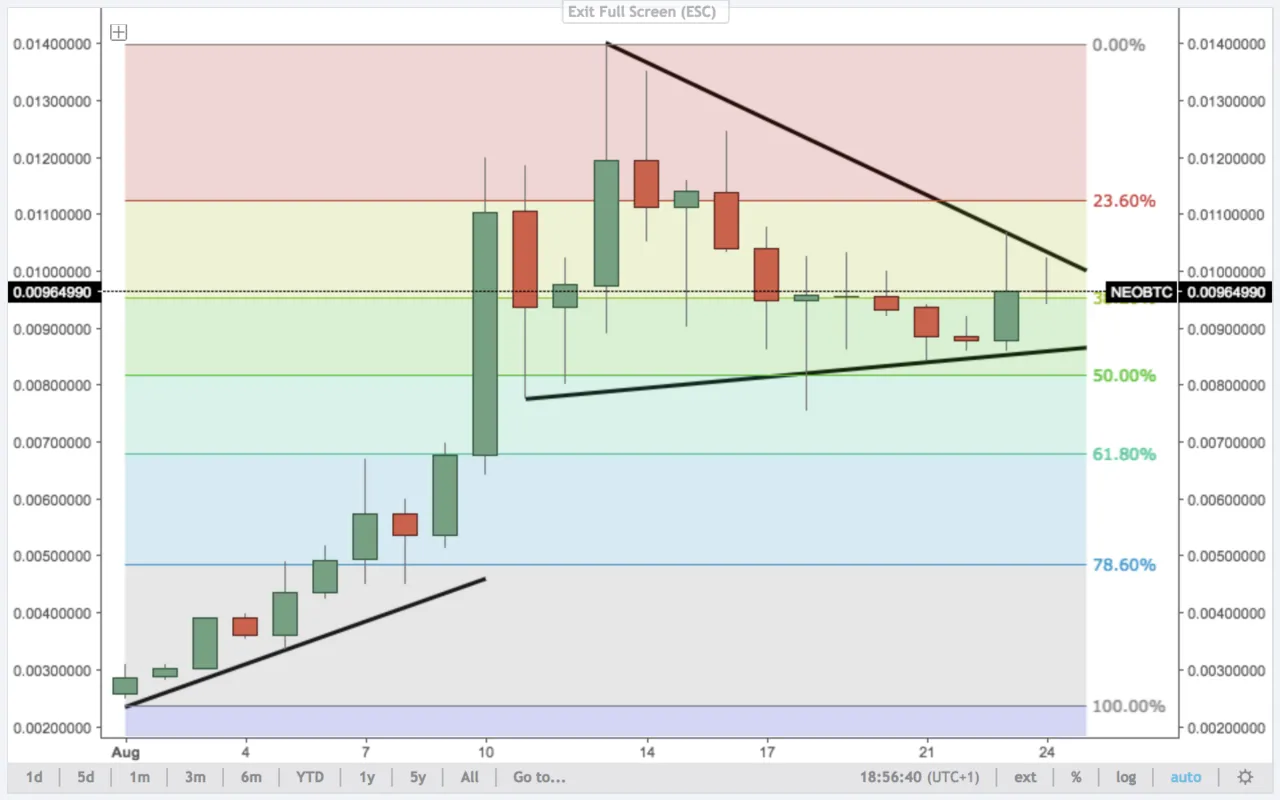
NEO/BTC - Daily
Trend = Sideways
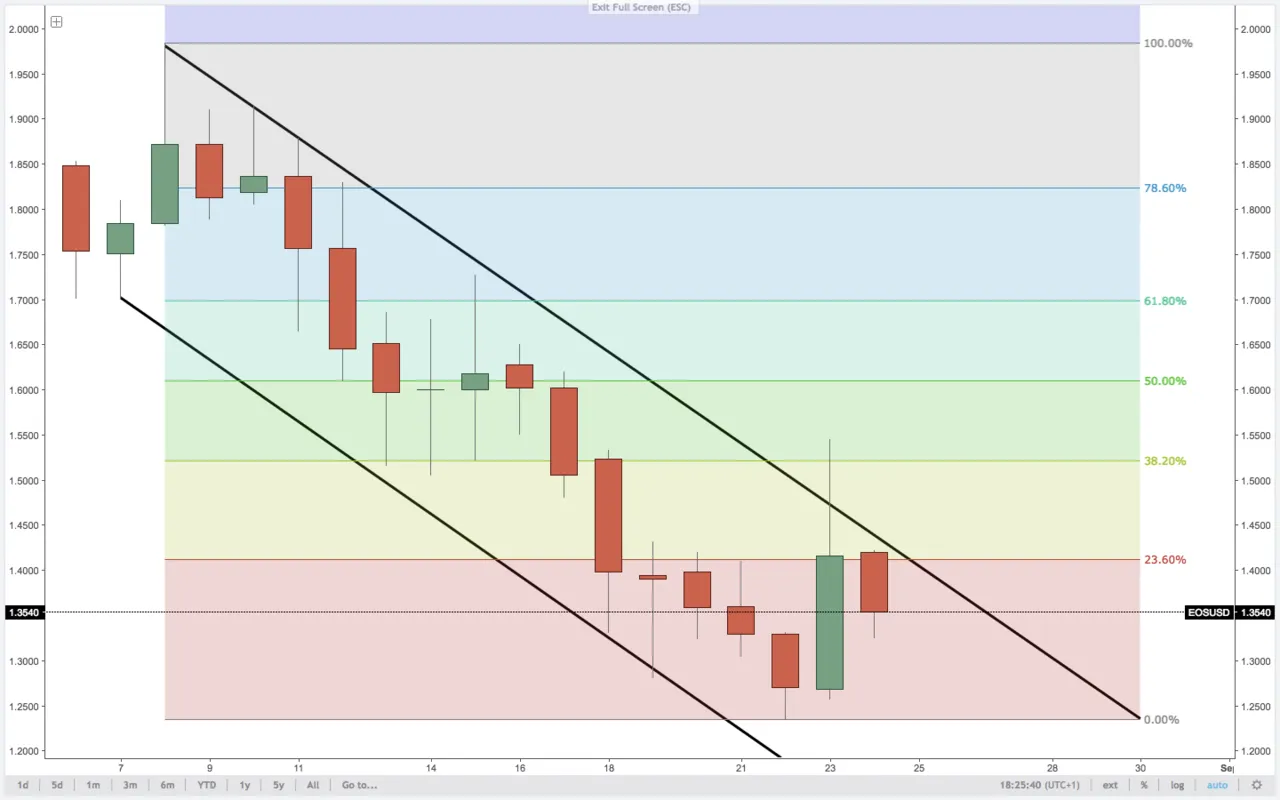
EOS/USD - Daily
Trend = Down
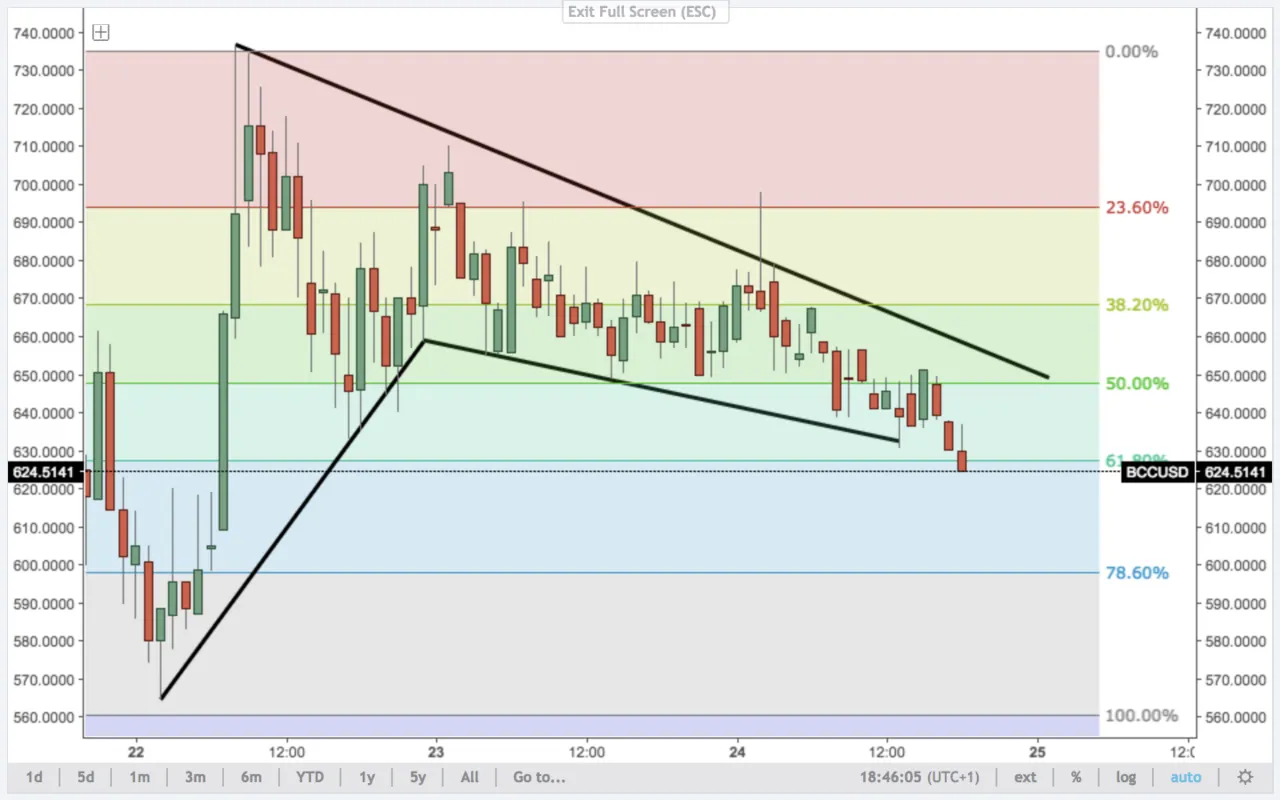
BCC/USD - Hourly
Trend = Down
The information contained herein is an opinion and is for information purposes only. It is not intended to be investment advice.