
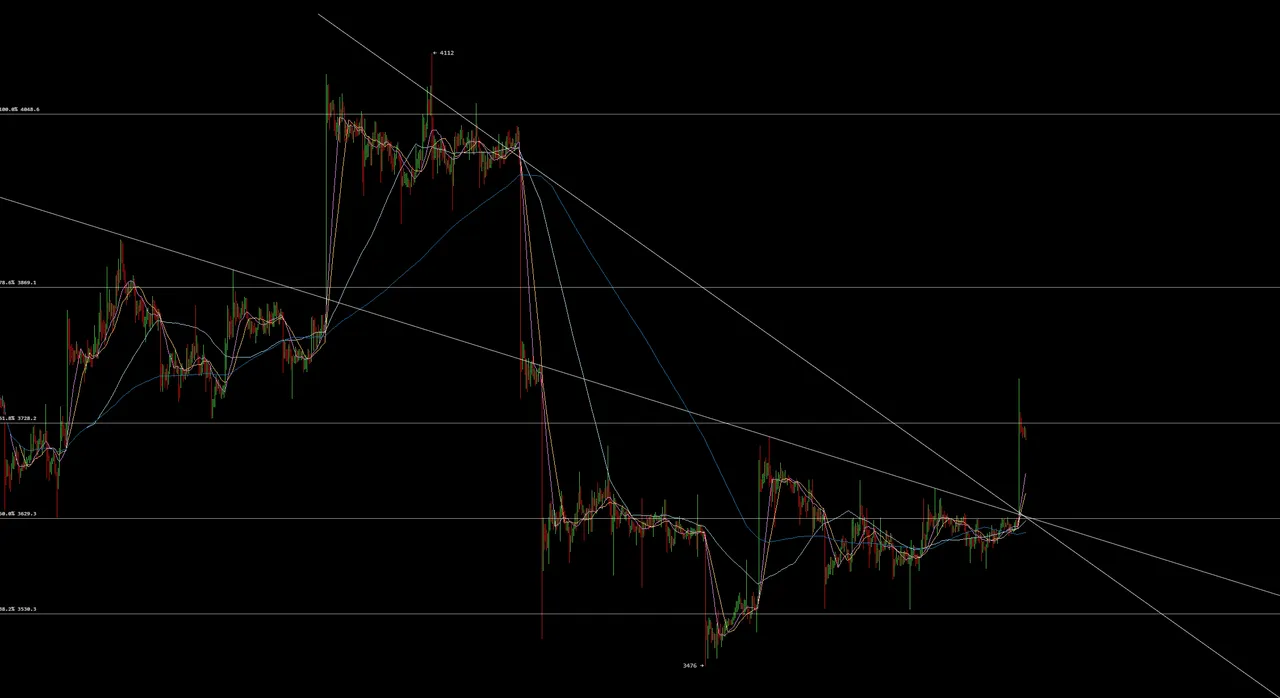
30min
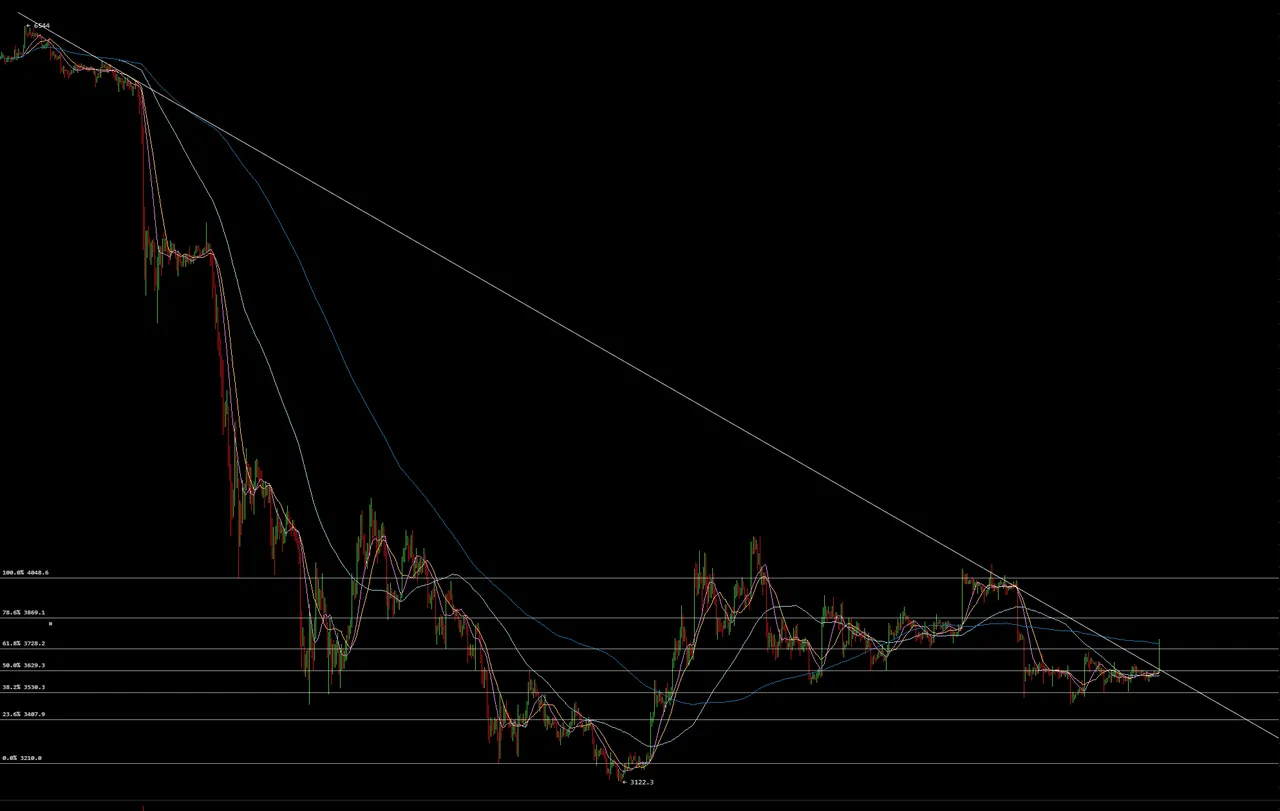
2h
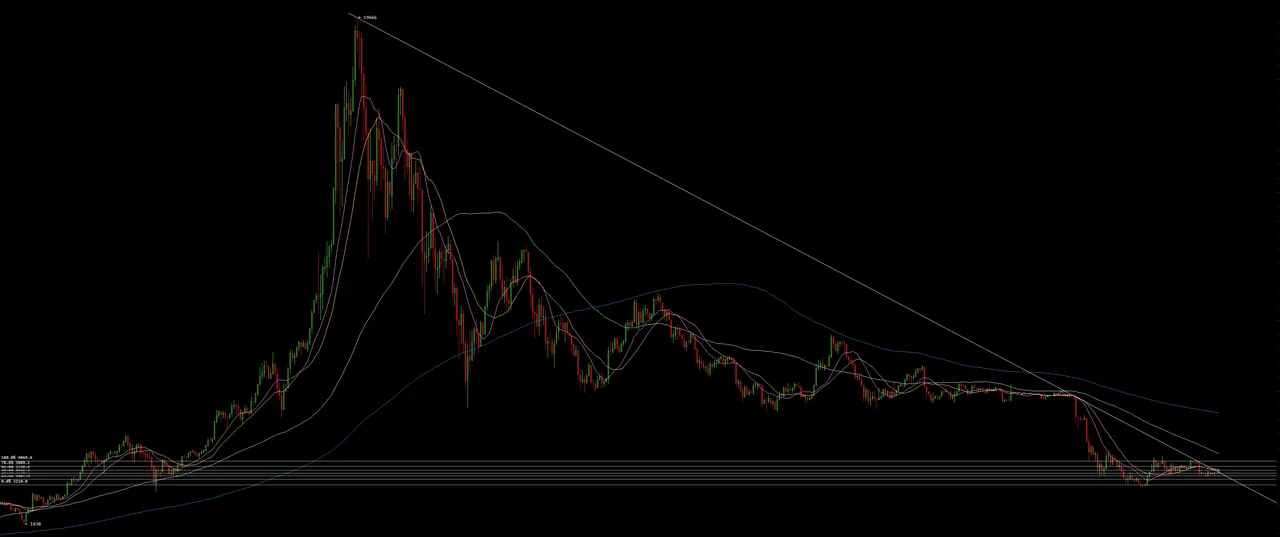
1d
We went through the 50% Fibonacci and the large descending resistance connecting the 2017 20K ATH and the 6.4K tip of the 2018 wedge and another short term descending resistance that converged in the same point in time and price, Upwards.
Breaking the overall Bearish looking pattern that could have led us to 3K or even below the 200 weekly MA towards 2.4K, like it did in January 2015.
Where do we go from here?
Looking 4 years back, most probable scenario would be bouncing up and down for another 6 months before a Final Dip followed by the Start of the next Big Bull Run.
But some "perma-bears" drool about targets like 1K and even lower while the "Moonboys" think we can start ordering thingz like these: