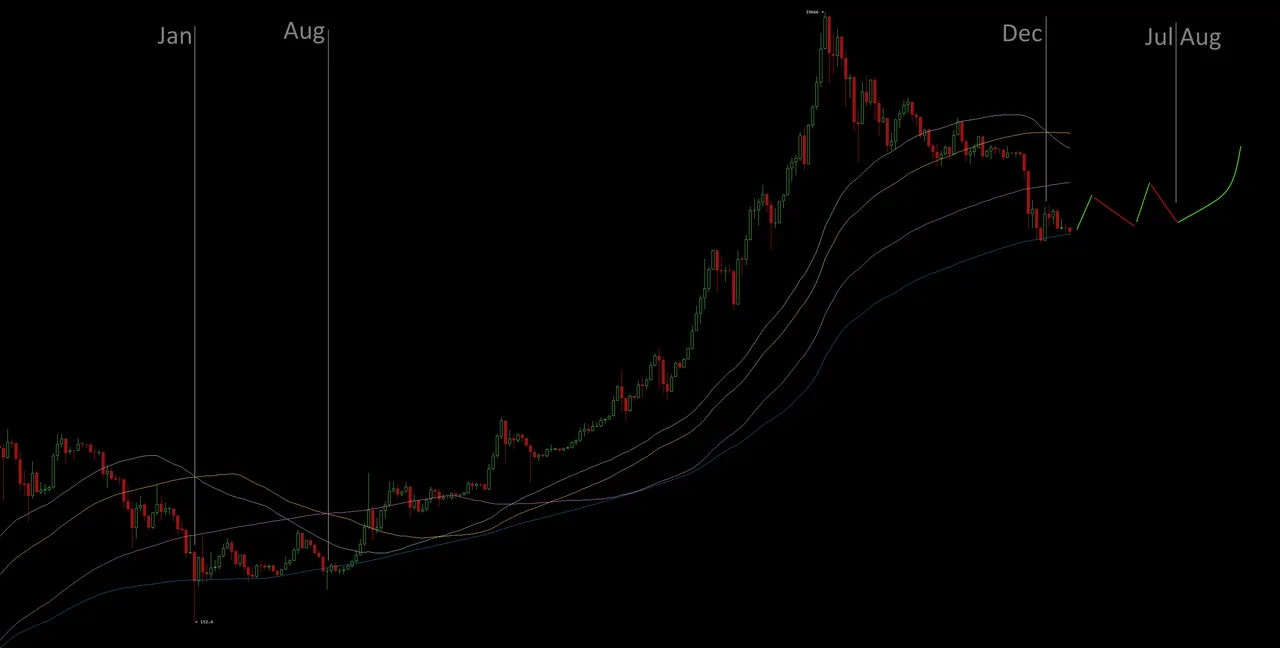
By finetuning the simple moving averages to match the moves of the last cycle, we can see if patterns are being repeated in the current one.
Steemit pictures suck, so here is a link to the original one:
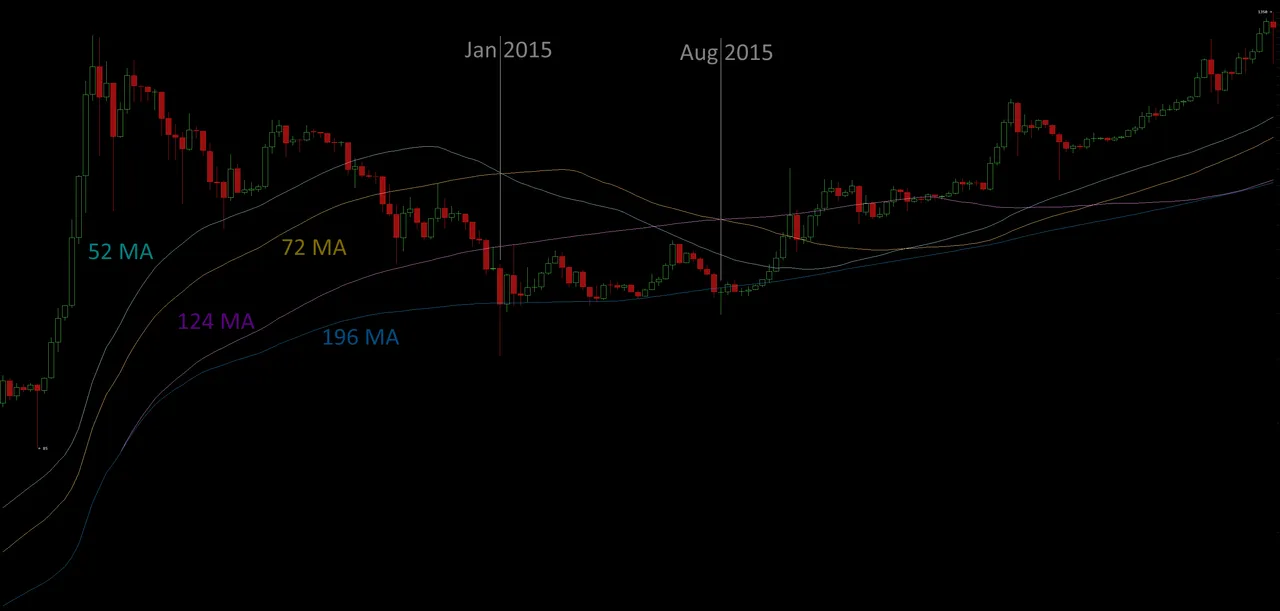
I have taken the 52 weekly Moving Average, as 52 weeks represent a complete year.
The 72 Moverage seemed to cross this 52 Moving Average at the point where the Bear market ended and the sideways move started.
Adding 52 to 72 we get 124 and the crossing of the 124 Moving Average with the 72 Moving average seemed to coincide with the end of the sideways movement and the start of the Bull run.
Adding 72 to 124 gives us 196, which is almost the same as the 200 Moving Average that is often regarded as critical support in trading.