Bullish Butterfly:
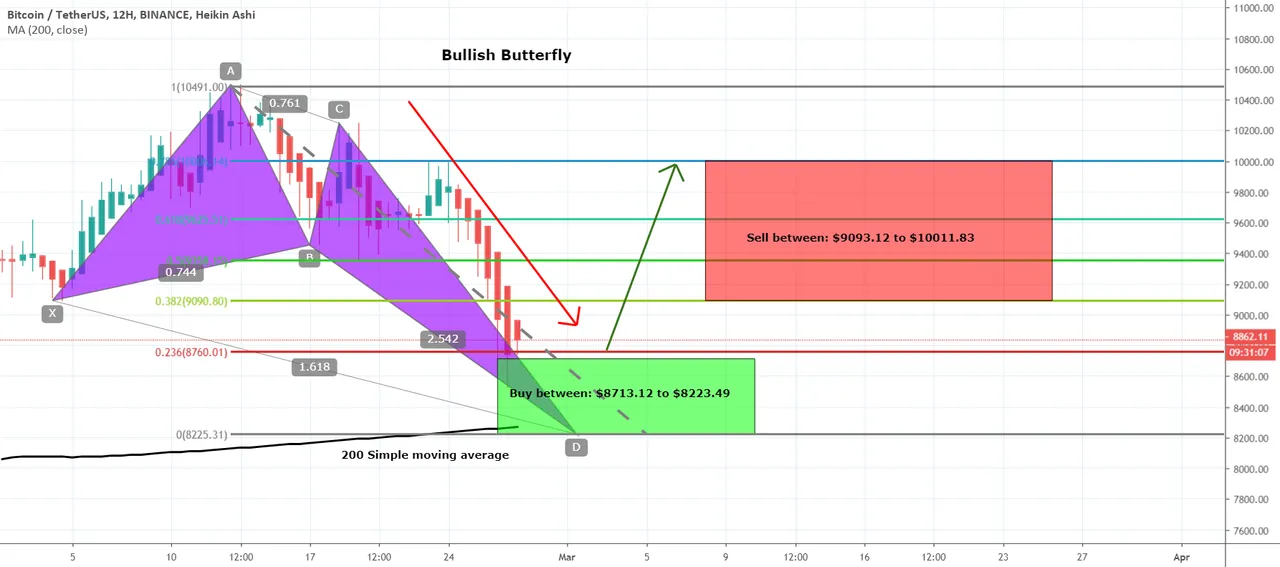
While in the bearish move during the period from 13th Feb 2020 upto 27th Feb 2020 the Bitcoin was giving some positive bullish signals the strongest signal that I found was the bullish butterfly pattern which was formed on 12 hour chart.
We also had a 200 simple moving average strong support in the potential reversal of bullish butterfly pattern.
Therefore I was expecting that the price action will enter the Fibonacci projection of A to B leg between 0.382 to 0.786 Fibonacci level then on 2nd Mar 2020 the price action started moving up and finally has hit the Fibonacci projection of this bullish butterfly pattern.
But so far the priceline of Bitcoin if not entered completely in this Fibonacci projection area. At this time 0.382 Fibonacci level is playing the role of strong resistance for the price action, once the priceline will be entered in this projection area after crossing up 0.382 Fibonacci projection then next resistance will be 0.786 Fibonacci projection for the Bitcoin and once the Bitcoin will be able to cross up the 0.786 Fibonacci projection then this level will also work as support for the price line of BTC.
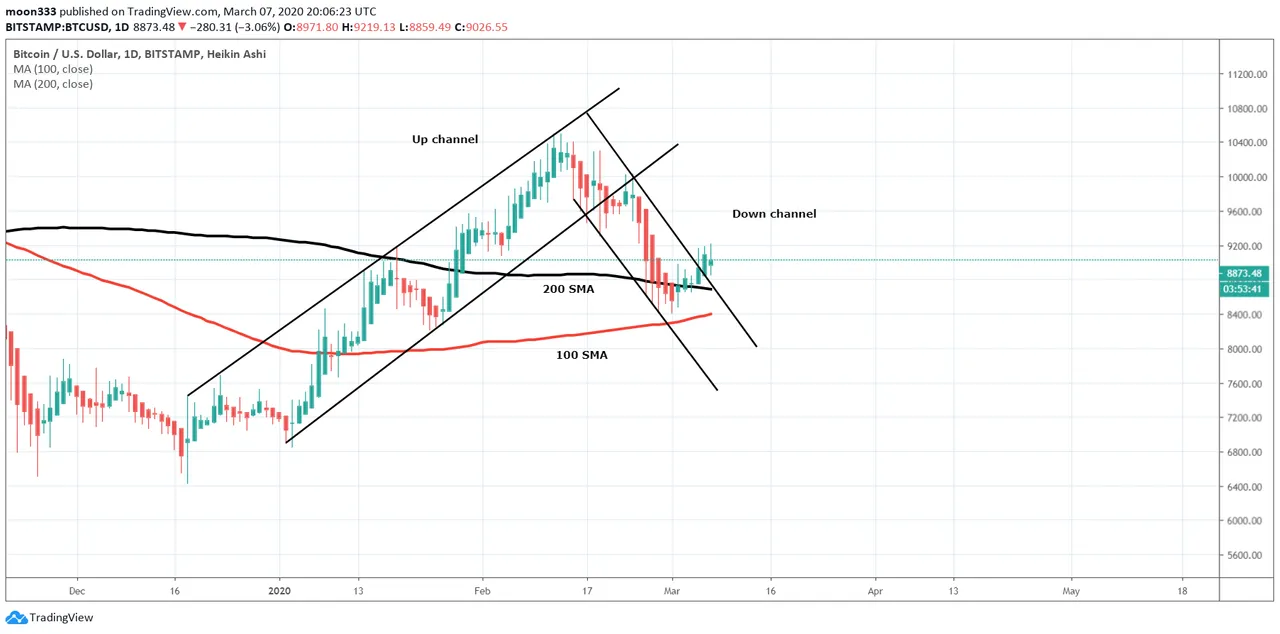
Down channel is likely to be invalidated:
We also have been watching on daily chart the Bitcoin was moving in an up channel and on 21st of Feb the BTC broke down the support of the channel and now it was forming it down channel with so many touches at the support of this down channel and the most positive signal was the 200 simple moving average. The price action droped at 200 SMA and consolidated at this level then price action moved up and broken out the resistance of this channel.
Now the price action may retest the support of this down channel and in case of successful re-testing the price action may move up and in case of failure it can again enter in the down channel.
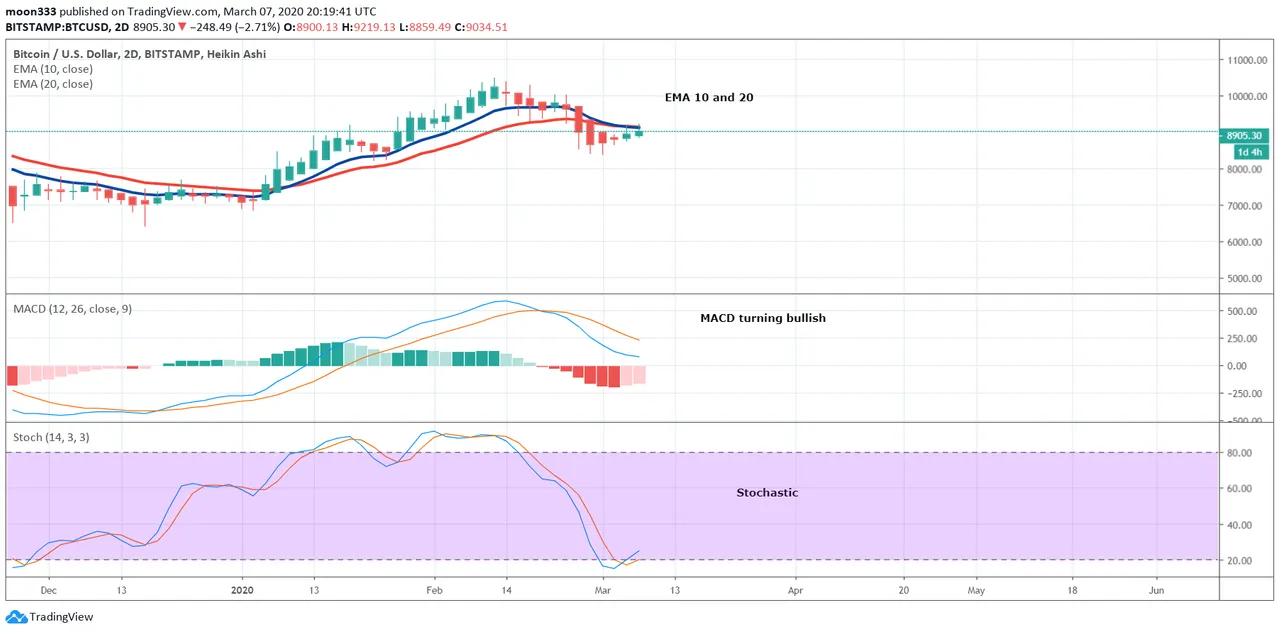
Indicators and oscillators turning bullish:
On daily chart the price action is taking bounce from the lower band of bollinger bands and the moving average convergence divergence has started turning bullish on 2nd March and we received a bull cross from stochastic oscillator and Relative strength index (RSI) had already visited the oversold zone and turned bullish.
Here if we see the momentum indicator then it is synchronized with the moving average convergence divergence indicator at this time both indicators are turning bullish and this is my experience that whenever the MACD and momentum get synchronized then the signal can be more confirmed.

EMAs are still resistance for the priceline:
Since the bullish move was started the price action was moving above exponential moving averages with the time period of 10 in 20 and Bitcoin was using these moving averages as support but unfortunately at the end of Feb 2020 the price action broke down the support of the moving averages. Here I was expecting that once the MACD will be turned bullish and we will receive a bull cross from stochastic indicator from the oversold zone then there are more chances that the price action will cross up again the exponential moving averages and once the priceline of Bitcoin will again cross up these exponential moving averages then it can again start the remaining part of the previous bullish move.
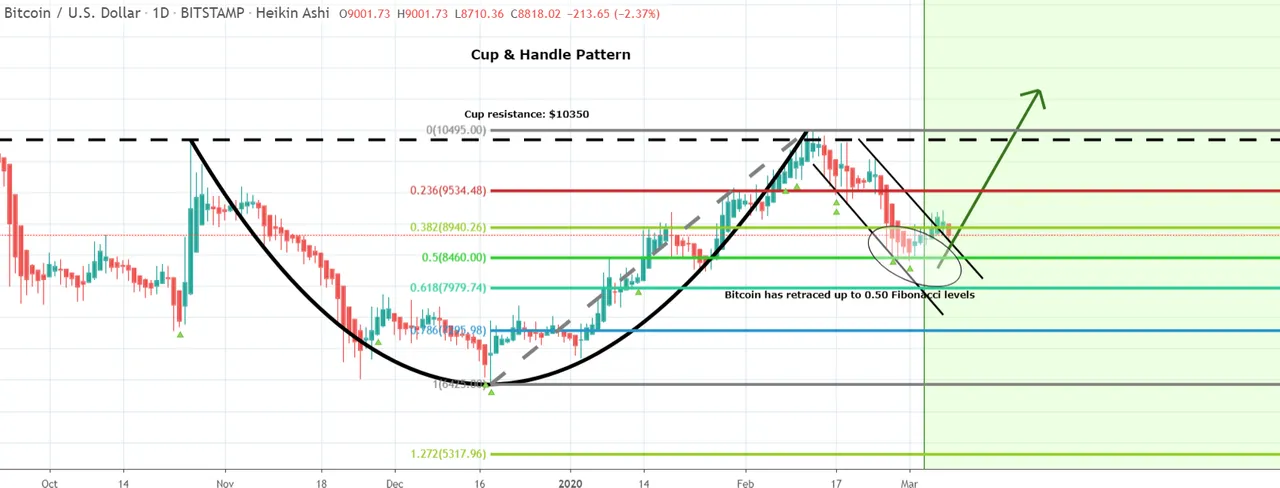
Cup & Handle:
Now let's talk about the Cup & Handle pattern which we have been observing since many days and I have discussed about this pattern in different articles. When the price line was moving in the down channel at the same time it was moving in the handle of the cup in the meanwhile the priceline had also retraced up to 0.50 Fibonacci level.
This level is the projection from the bottom of the cup up to the top. When the price action broke out the resistance of the down channel at the same time the priceline also broke out the resistance of the handle now the Bitcoin may retest resistance of the handle as support and in case of successful retesting the support the price action may move up to the resistance of the cup that is at 10350 dollars. And there are strong chances that the BTC may break out the resistance of the cup because in more than 80% cases whenever the price action breaks out the resistance of handle of the cup then it also breaks out the resistance of the cup is well.
Long term trend line:
Here I would like to talk about the trend line which is formed on the long term weekly chart below the price action we have so many touches on this trend line therefore this trend line cannot be ignored. If we place the volume profile on the complete range of priceline moving above this trend line then we can see that we have the POC of this volume profile at the same level where we have the resistance of the cup and that is $10350. The POC of volume profile always works as centre of gravity and it always pulls the price action towards itself but it is very much important for the price action to cross up this POC level as soon as possible because if the price action hits few more touches at this level then we will have a trend line above the price action and in this case a down channel on long-term chart will be formed then it will be difficult for the price action to cross up resistance of the down channel and we may have bearish friend. And in order to break out this POC level we will need buying volume like we had from Feb 2019 up to June 2019.

I will keep posting more updates on BTC moves.
//////////////////////////////////////////////////////////////////////////////////////////////////////////////////////////////////////
Earn Money for posting articles
and content:
PublishOx:
https://www.publish0x.com/@moon333 Uptrennd
https://www.uptrennd.com/signup/NTI3Nzg
Patreon:
https://patreon.com/invite/xkmjnn read.cash:
https://read.cash/r/moon333
Read.cash:
Steemit:
///////////////////////////////////////////////////////////////////////////
My social links to follow:
Tradingview link:
https://www.tradingview.com/gopro/?share_your_love=moon333
Facebook:
https://m.facebook.com/Moontriple3
Twitter:
https://twitter.com/moon33367268705
Youtube channe:
https://www.youtube.com/moon333
Telegram:
https://t.me/moontripple3
///////////////////////////////////////////////////////////////////////////
Links for best crypto trading
exchanges:
Binance:
https://www.binance.com/?ref=11256882
p2pb2b:
https://p2pb2b.io/referral/376549a8-b6e9-4ae7-82c8-34cdba324ebc