
Expected trading for today is between 10200.00 support
and 12900.00 resistance
key support 10700.00 / The start of the crash zone /
but technical indicators provide positive
factor that support bullish trend.
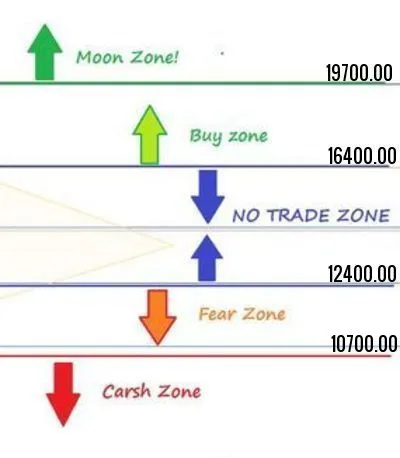
Bitcoin price now is around 11000.00 / the fear zone/.
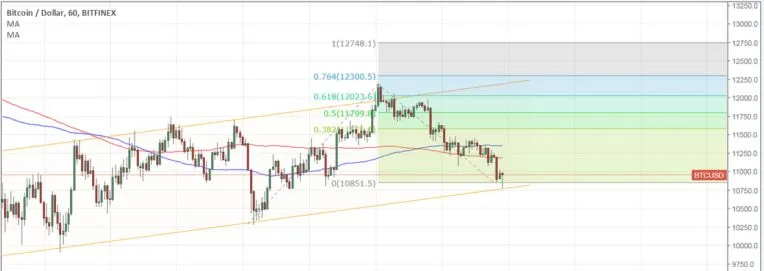
Technical indicators signal, bitcoin price could go from here towards 12400.00 level, if the range 10200.00-10700.00 holds.
Volume is low as traders remain cautious, but I still suggest the bullish unless breaking 10200.00-10700.00 range.
Breaching 12400.00 level and hold above it, will push the price towards 12900.00 / close to 100 % Fib Extension.
100 SMA is above 200 SMA so the upside move is more likely to continue.
RSI indicate a return in bullish pressure and stochastic reach to the oversold areas to suggest a bounce from here.
Note; Breaking 10200.00- 10700.00 range, will cancel the bullish trend and will push the price to re-test the low of year at 9300.00 before any new attempt to raise.
Expected trading for today:
is between 10200.00 support and 12900.00 resistance.
Expected trend for today : Bullish.