1 day candles
The yellow trend line which has been the been the peak for 3 previous highs starting on 20th January 2018 was broken on 23rd of July.
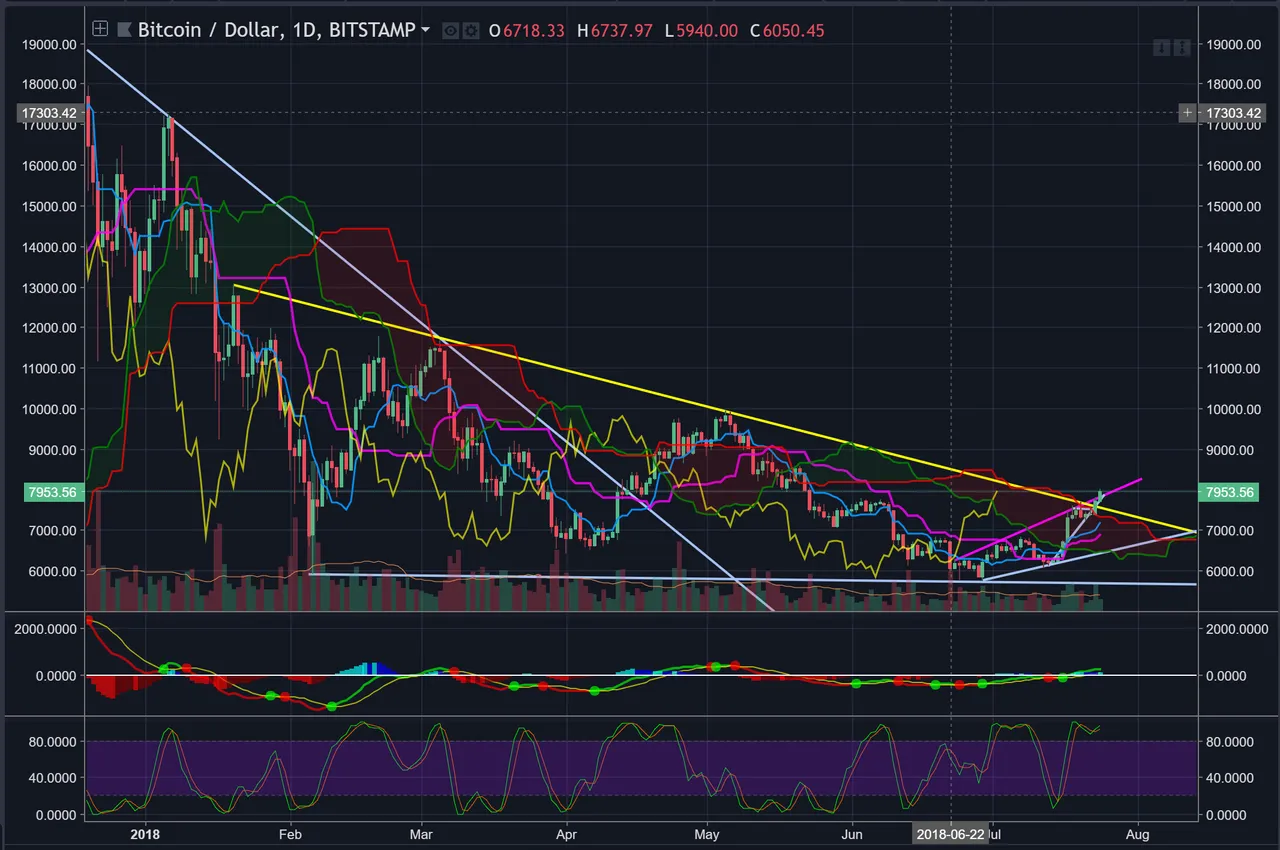
This also saw us break above the ichimoku cloud on the daily chart.
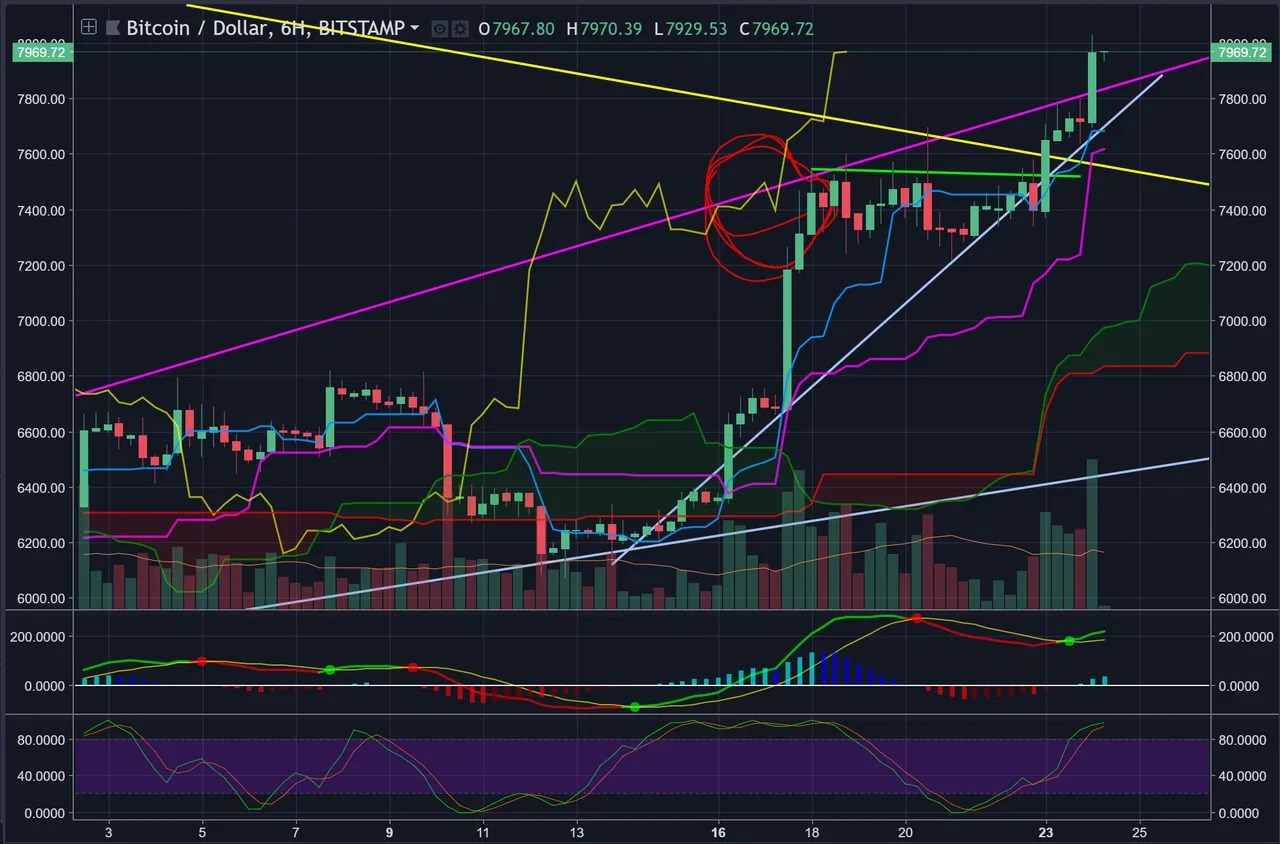
6hour candles
6 hr candles broke above the ichimioku cloud and had a good strong bounce out of the cloud. which formed the hieght of our bull flag. We can see the lagging span indicating the point (red scribble) where the price bounced further.
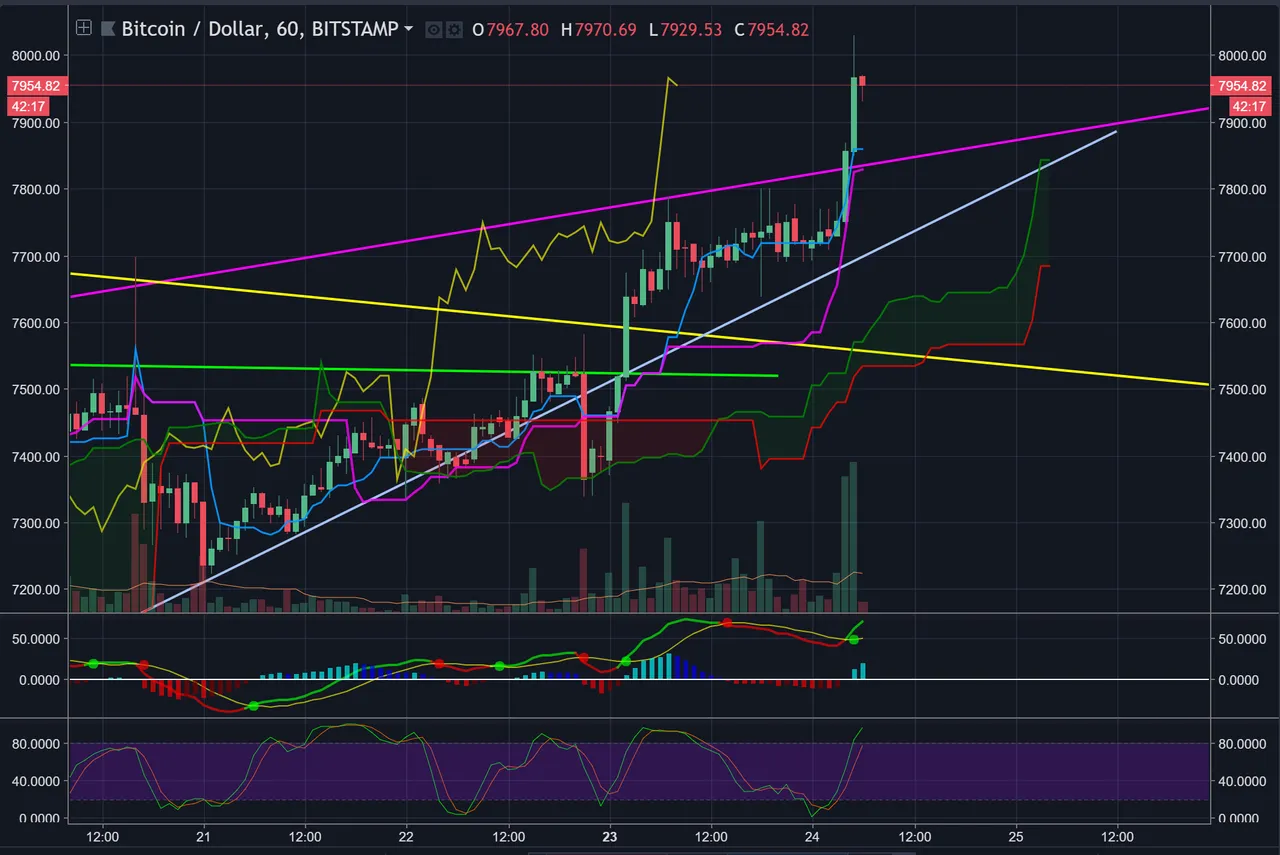
1hr candles
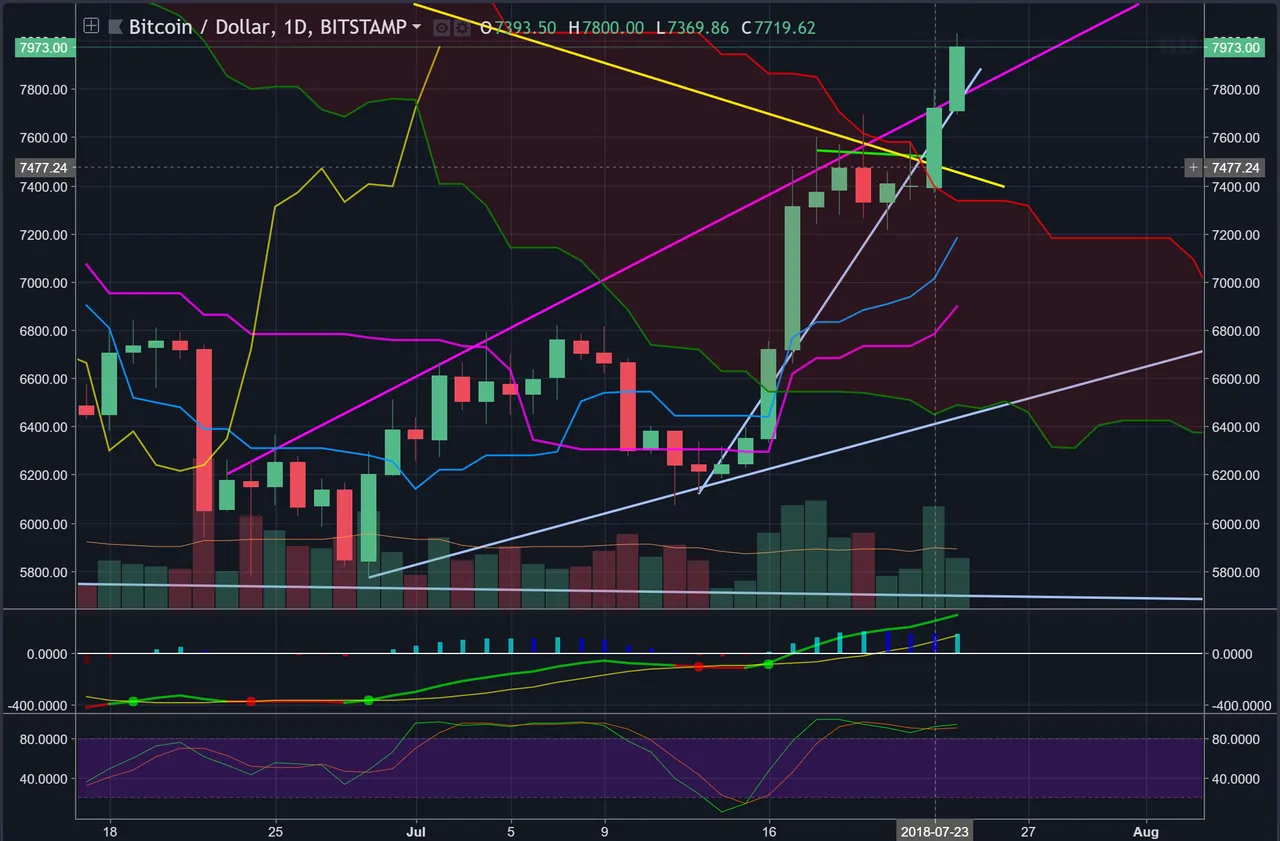
In the 1 day chart above we can see the length of the magenta trend line spanning back to the high prior to the bottom on the 29th June 2018. This magenta trend line was also broken with a close on 24th July.
Disclaimer: This information is to record and preserve on chain my observations of this technical analysis system, I do not advise making trades with real money from this information. You may lose your shirt or other spurious items of clothing with a possibility of starvation and death if you trade this information.