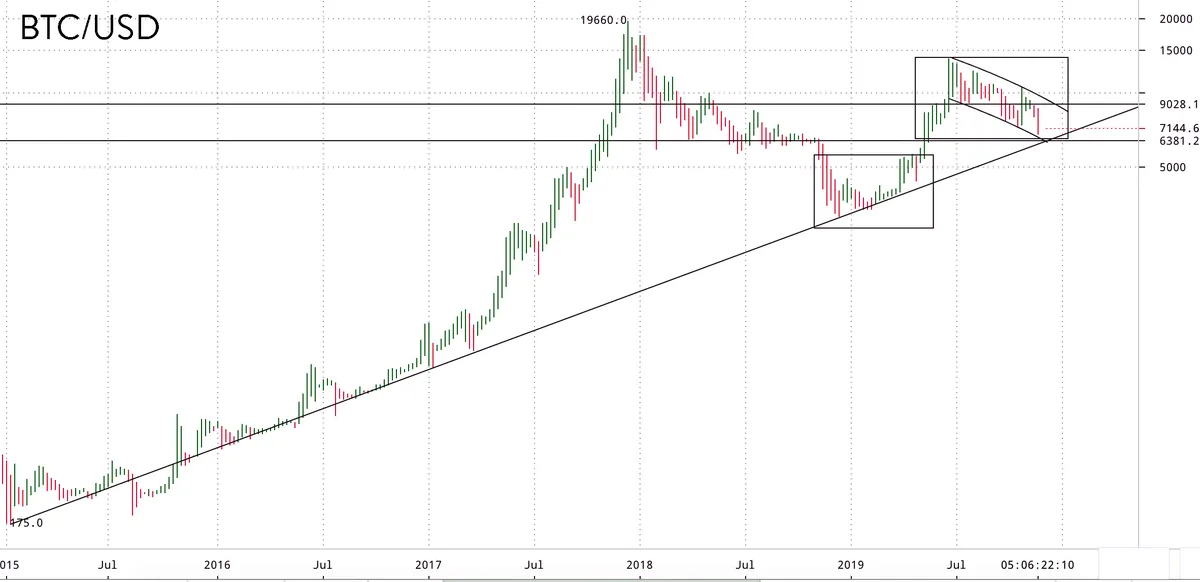
Bitcoin prices hitting a trend-line not seen since March of 2019
This trend line can be drawn since the start of the parabolic move back in 2015.
Bitcoin hasn't really touched this trend line since March of 2019, and we all remember what happened from there.
Check it out:

(Source:
)https://twitter.com/TuurDemeester/status/1197934885287211008
- TuurDemeester
As long as this trend line holds, it looks like a great spot to accumulate.
The downside is, what happens if this trend line breaks?!
We will revisit that line of thinking when/if it actually happens.
Stock to flow model still looks good as well
The bitcoin stock to flow chart still looks fine as well.
It will take a big move down for this model to fail.
This model basically helps smooth out the violent short term moves (such as today) and helps keep a longer term investing thesis in mind.
As of right not, it looks like business as usual:

(Source:
)https://twitter.com/100trillionUSD/status/1197847212358819840
- 100trillionUSD
Things still looking a lot like they did back in early 2016, before the bubble really started inflating.
According to the stock to flow model, we won't really need to be concerned about bitcoin unless it goes super low (like $1-2k area), or we are not $100k within the next 2-3 years.
My not so expert advice for the current times?
Buy the dip.
*This is not trading or financial advice, this is just some dude on the internet stating his opinion.
Stay informed my friends.
-Doc