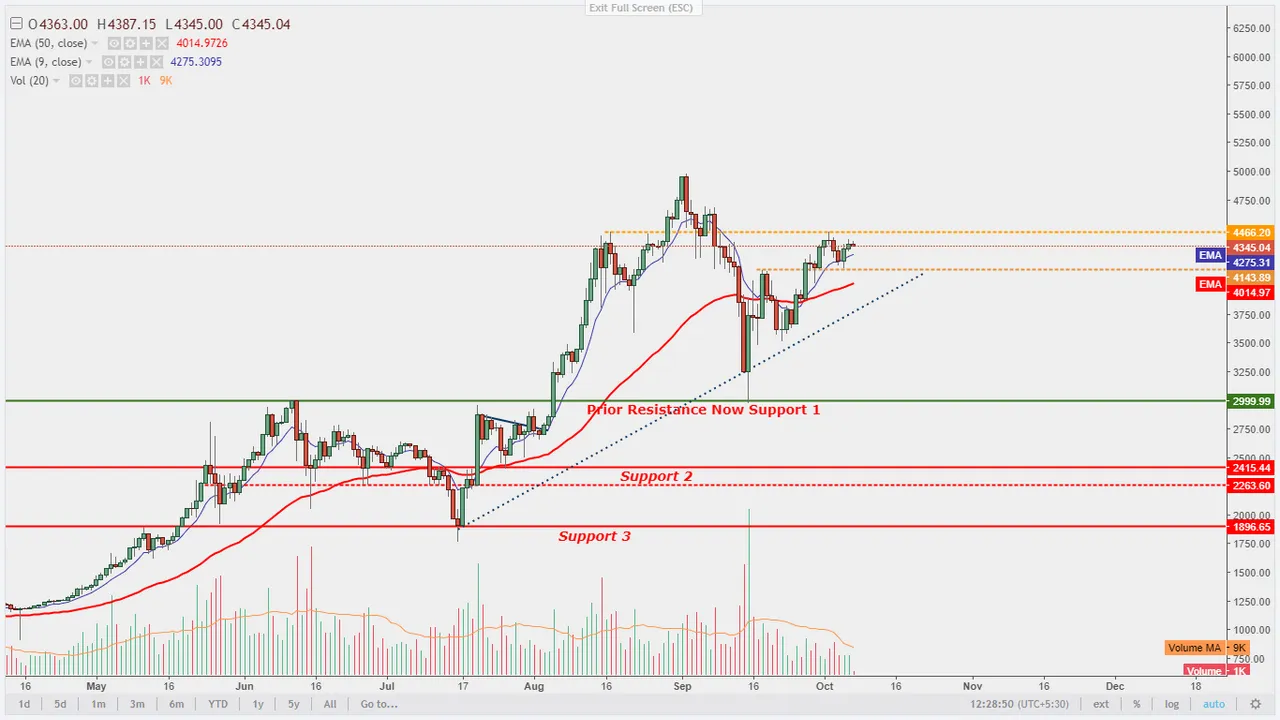
Bitcoin has been trading with positive bias since it hit the low of $2975. Its been creating higher highs and higher lows pattern which generally indicate strength in ongoing uptrend. Currently it is trading at $4345 with little negative bias as it has been facing resistance around $4400 level for last five six days.
Let me now take your attention on chart below to access what in store for present and future........

Above is daily chart which is showing following:-
Range Bound Trading
Bitcoin's underlying trend is up but as one can notice on chart above that after hitting the high of $4462 , it is now in consolidation mode and in this consolidation it has made a range of $4162-$4404, which i highlighted in parallel orange color horizontal lines. This range may continue for few days and after that it may breakout or breakdown from range. Short term traders may use this range to trade by selling on top and buying at bottom with strict stop loss. And Long term traders or investor may look out for breakout as chances are high of breakout owing to setup and underlying trend. But if Bitcoin breakdown from this range then one must not burn their hand by buying it in hope.
Buyers in Control
Short term and long term moving averages are showing upward momentum which indicates buyers are still in control. Time and again sellers came and will come to test the buyers strength but as long as bitcoin is above 50 Days EMA (red wavy line) and long term trendline (shown in blue dotted upward diagonal line) one can consider Buyers control in this script.
________________________________________________________________________________
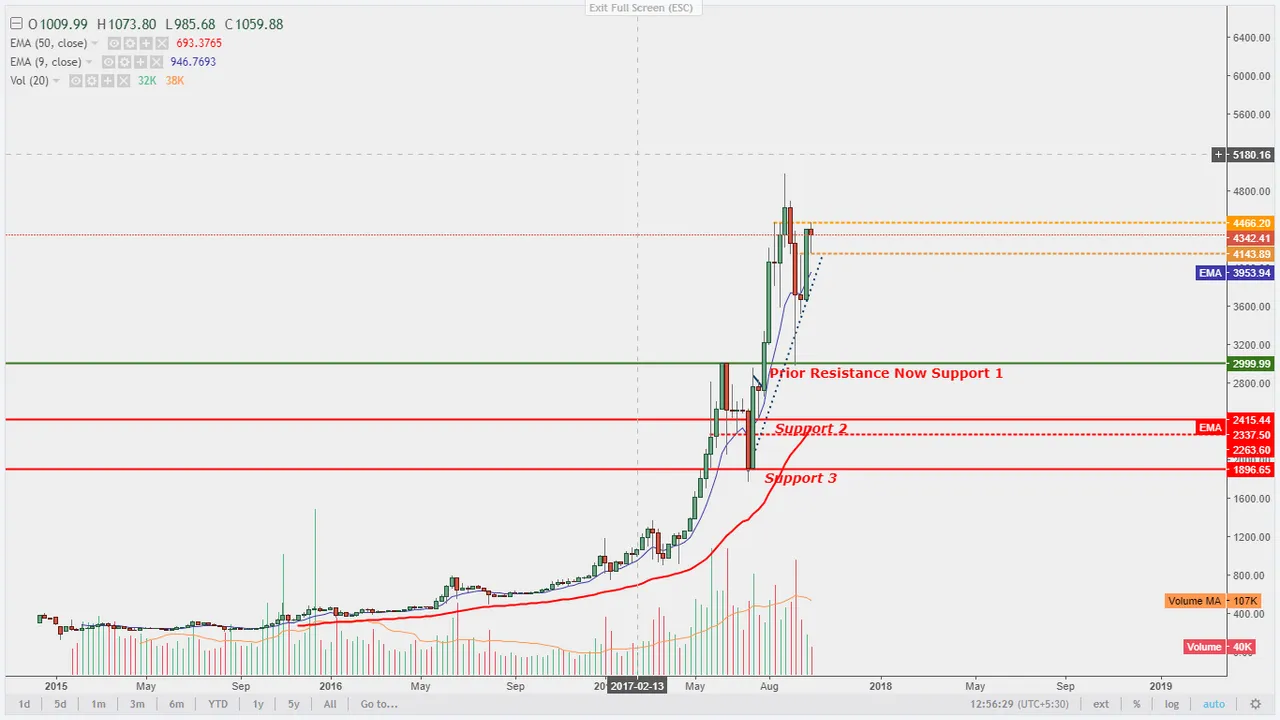
Now lets take a quick look at weekly chart below to figure out whats big boys are thinking or doing ........

Chart above is also showing buyer strength and one can clearly notice big green candles as compare to red candles which are visibly few and short in lengths. But their is one cause of concern also as these swift upmoves may get small investors complacent and they can easily be knocked by big boys once they started shaking the markets. Every market runs on supply- demand and buyers- sellers. So, when bigboys don't find sellers to transact they tend to bring the price down which happen recently at $5000 level but that shake up didn't last very long, making small investors more complacent and confident which is why i am expecting one more shake up before scaling further high for this script.
With that said i rest my analysis here with the hope for small investors to protect their finances by understanding the dynamics of market and by reading'n' following the charts.
________________________________________________________________________________
If you like my analysis do not forget to upvote, follow, comment@jimmyrai28
if not then criticize, this also will be highly appreciated.
You can also drop a comment in 'reply' if want you want me analyze any script of your choice.
Now you can also find me on discord channel: https://discord.gg/VvHmhvH