
(image from newsbtc.com)
As the master, himself, Warren Buffet has said of wise investing:
"Be fearful when others are greedy and greedy when others are fearful."
Does this mean that we should simply buy in the middle of a market slaughter? People are typically fearful when markets drop by over 10% overnight, right? So is that good enough reason to buy? Should we buy bitcoin now that it has dropped over 30% in the last four days?
Well, first of all, it depends on whether you're bullish on bitcoin's long-term potential. If not, you shouldn't be anywhere near it, unless you plan to play it as a "lotto" (play), in which case you'd be foolish to invest anymore than you would into a pile of lotto tickets. Secondly, it depends on your investment plan. For a scaling approach (buying in small lots or percentages of the total planned position with the plan to buy similar positions at future time increments or price levels), buying on a "big dip" might be effective and prove profitable in the long-run.
However, if you're planning on dropping a "boat-load" onto BTC, it would be better to wait for signs of a new market bottom (such as indicated by the "golden cross" of the 50 and 200 simple moving averages for the 1-hour candlestick time-frame and above) or to enter after a bullish pattern breakout or within a "potential (bullish) reversal zone" with logical stop-losses in place, just in case the market doesn't turn as we had hoped.
When the Market is Falling Apart from the Seams, Profit is Most Often Made at Confluence Zones and Potential Reversal Zones (PRZ):
Confluence Zones:
Many technical-analysis chartists/ traders have a list of trade patterns that they look for and/or statistical tools to measure price movements which help them decide when and where the market might turn in their favor. Almost all traders and analysts have at least a rudimentary grasp of traditional support and resistance levels, trend-lines, and moving averages.
In my opinion, the best, most consistent and profitable traders, have a grasp on all of the above and use them together to find price zones where two or more of the indicators for reversal are in agreement. A confluence zone is any price level on a chart that has two or more indications of reversal within a relatively tight price range (zone). The idea is that the the buying pressure (in the case of a price correction within a bull market) should be higher, the more TA indicators that signal a price turn.
Why? Because well over half of the market participants are using one or more of the TA analysis methods to determine where and when to enter the market. If more than half of those methods are in agreement that it's time to buy, then many buy orders are likely to come in at that level. The more TA indicators that signal it's time to buy, the more buy orders we should expect to come. Hence, these are very logical price levels to buy.
Potential Reversal Zones (PRZ):
Many relatively newly discovered chart patterns such as those used in "harmonic trading" have what are called "potential reversal zones" (PRZ), which are small prize ranges that have a relatively high probability of "capturing" the reversal price (into a new bullish impulse move) and are determined by price completing a strict ratio pattern of price swings relative to earlier price swings. The below image offers a glimpse into common harmonic patterns (image borrowed from c.mql5.com).
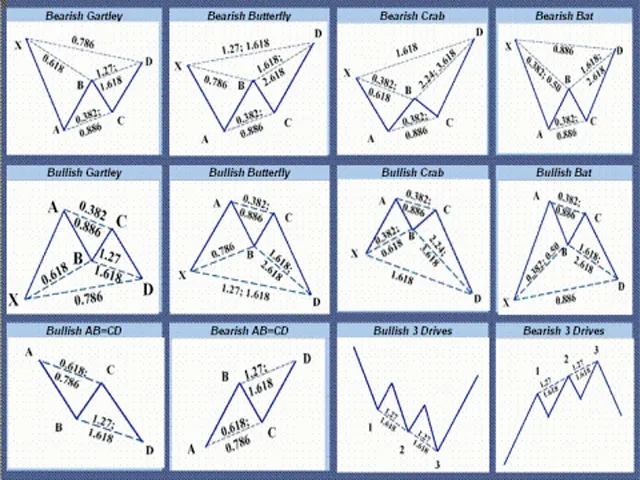
You can read more about harmonic patterns here.
You can view my personal harmonic patterns "cheat sheet" here.
Logical Stop-Loss:
Since no trade/ investment entry plan is bulletproof, it's wise to either:
1.) never put in more than you feel comfortable losing, should the trading instrument fall all the way to zero.
2.) set up an automatic "cut losses" price (stop-loss) at a price-level that's only likely to be hit if all your indications of a continued bull-market are incorrect and at which you'll take a loss that's acceptable to you.
Often times when I invest I'll settle on option #1, but I ALWAYS go with #2 when I'm trading (have a target price in mind to take profits). That being said, there's nothing wrong with planning to hold a position for the long-term AND having a stop-loss. In fact, that's probably the wiser decision for most people's financial circumstances.
Where to put the stop-loss is probably the most difficult decision for most traders when it comes to planning out and/ or executing their trade., I know it is for me. As with our entry price, it's ideal to have a confluence of support(s) between the price that we enter the trade/ investment and the stop-loss.
A good place to start is by having one or two horizontal support (zones) between entry price and stop. It's even better if we can get a trend-line between the two and better yet if we can have other types of support like significant Fibonacci retracement levels and major moving averages like the 50, 100, and 200 simple moving averages.
Keeping that in mind, we can't forget about how much we're risking to lose by settling on the stop-loss price. While it's true that our stop-loss has less of a chance to be hit if we put it well below our entry price it also comes with a bigger loss versus keeping it "tighter" to entry.
Putting it All Together...
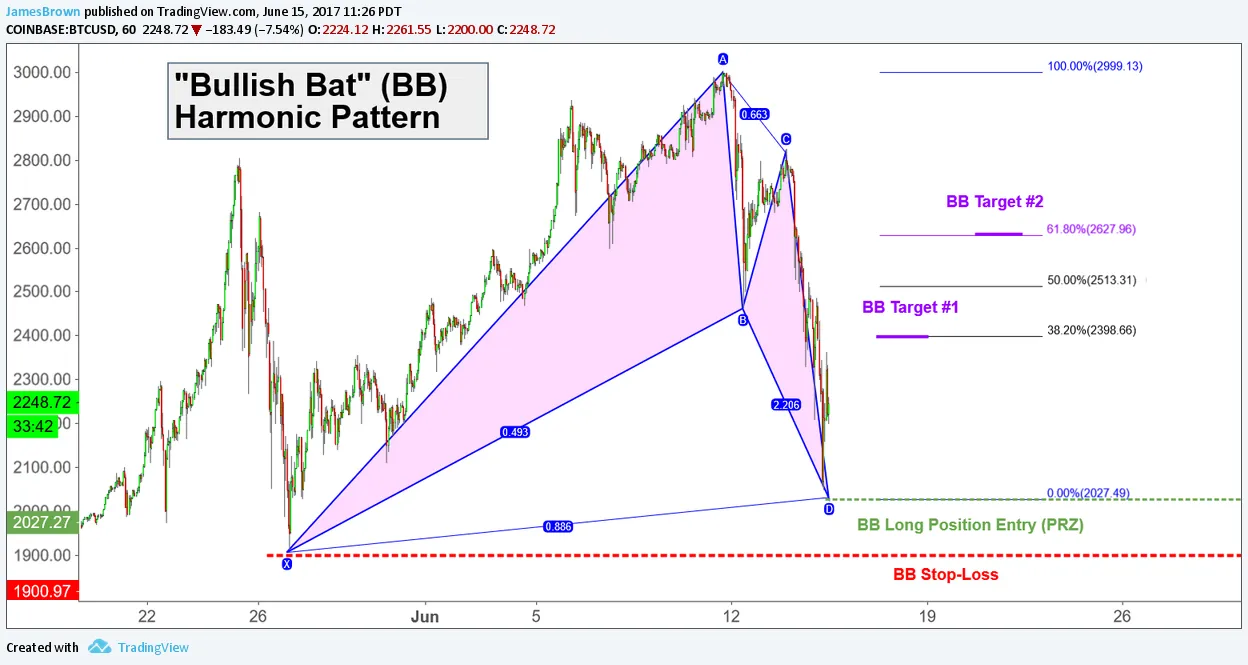
CHART 1: 1-Hour Candlesticks of BTC/USD (Coinbase), Harmonic Pattern Outlook:
https://www.tradingview.com/x/fVxewqHr/ (click for bigger image)
CHART 2: 4-Hour Candlesticks of BTC/USD (Coinbase), Support Line(s)/ Trend-Line(s) (Bullish Bat pattern still highlighted):

https://www.tradingview.com/x/l57uOy1U/
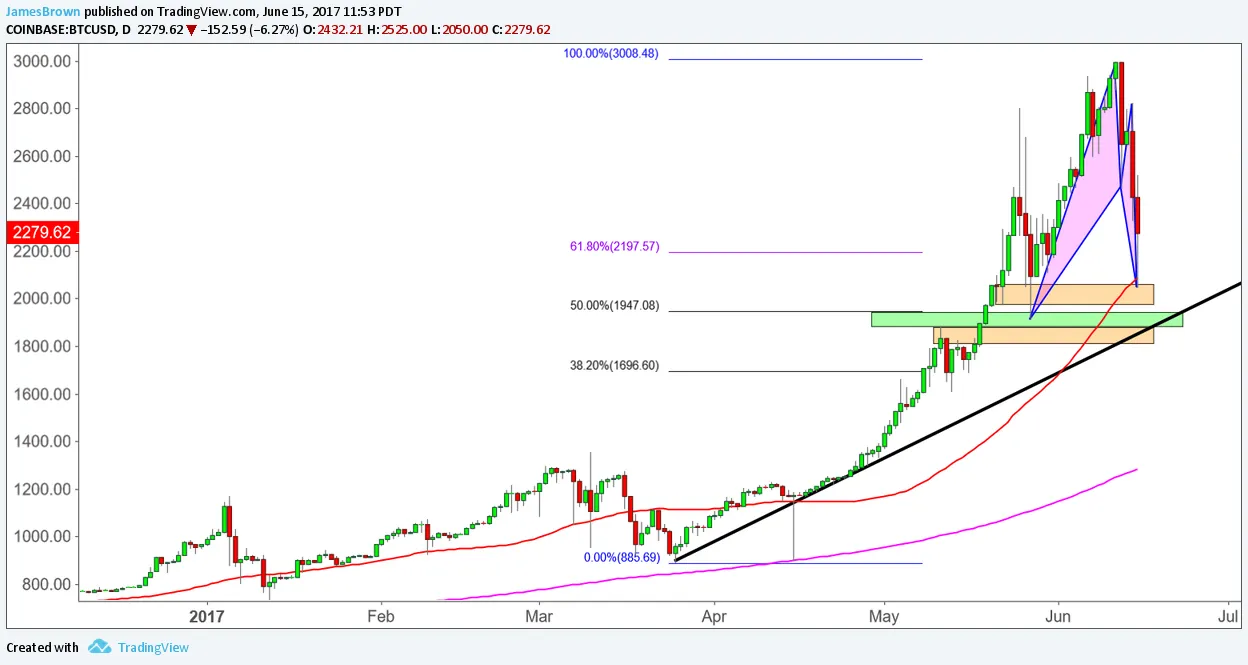
CHART 3: 24-Hour Candlesticks of BTC/USD (Coinbase), Moving Averages/ Trend Lines:
https://www.tradingview.com/x/vqPahfWd/
... We Build Our Case for or Against Taking a Position -- Chart Analysis Time!
Just in case you haven't already noticed, each chart builds on the one above it (chart 1 to 2 and 2 to 3).
The first chart shows a simple harmonic pattern, called the bullish bat (BB) pattern. On the chart I lay out the traditional entry price (about $2,027, although I'd personally shoot for an even $2,000.00 entry for a better reward to risk on the position), stop-loss price (about $1,900.00, although we could make a much "looser" stop in the case that we're targeting an adequately high price to give better than a 1:1 reward to risk or are entering as a long-term investment), and the two target prices for this pattern (around $2,398 and $2,628).
If looking to purely trade bitcoin, seeing this pattern alone could be enough to take a shot at it.
Moving on to chart 2, I highlight significant support zones (areas where price has shown strong buying/ selling pressure in the past) in light orange and a confluence zone (with a significant level of the Fibonacci retracement tool that I drew onto the chart, specifically the 50% retracement level of the price swing) in green. We also see a trend-line (thick black line) and two moving averages: 50 (red) and 200 (pink) simple moving averages.
This extra information gives us a better idea of how strong of support we should find from buyers below the first buying opportunity (BB entry price) and where better (lower risk) entry levels are located. Because the first real confluence zone (green rectangle) is between about $1,880 and $1,950, it's both a logical price range to consider taking a long entry and also a logical price zone to place a stop-loss below, in the case that we take the BB trade.
Taking chart 3 into consideration, we see that the price has just tested the 50 (red) daily simple moving average (DSMA) and that the 200 DSMA (pink) is a good distance below the price.
Knowing that these longer time-frame moving averages tend to have a "momentum" or "pulling effect" to them could help build the case that entry between $1,880 and $2,000 are solid choices, seeing as price would have to dip a bit below the 50 DSMA in order to reach those levels.
However, seeing the good distance between the current price and the 200 DSMA is a little disconcerting for traders/ investors like me who like to have the support of the long-term moving average. Markets have a tendency to only trade so far away from this moving average before stalling and migrating back to it for a "test". This could signal to some to either avoid taking a position altogether or to size-down on the amount of money (size of position) that they're willing to risk on it.
Don't Forget the Fundamentals!
The more information that we have, the more informed of a decision that we can make. While my larger focus goes to seeing market patterns and trading human psychology, I always try to have some grasp of what's driving it all in the "real world".
Coming up in early August, we could see bitcoin hard-fork into two different block-chains. With this as a possibility, many market participants may decide to stay away from bitcoin as an investment, which could lead to these usually dependable technical-analysis indicators having lesser influence on individual trading decisions.
One saying that I heard early in my trading career, which I wholeheartedly agree with is:
"Big news/ announcements trump technical-analysis forecasts."
In the case of bitcoin (with respect to the potential hard-fork in August), a lot, if not most, of the market will likely be uncertain about what to expect and that usually doesn't bode well for the bullish-camp.
Even for those with strong bullish biases, who believe that bitcoin will come out stronger on the other side of the upcoming soft-fork and potential hard-fork, it still might be wise to target the lower risk long-entry signals, such as on the low end of the confluence zone (around $1,880, although I might target a bit lower at around $1,850 to $1,800).