I don't have a lot to say about the price action in the charts, specifically, only that it may be useful to have in the future as more price action comes in, when these lines may (or may not) prove their relevance.
Zoomed Out 3D Log Chart (Bitstamp):
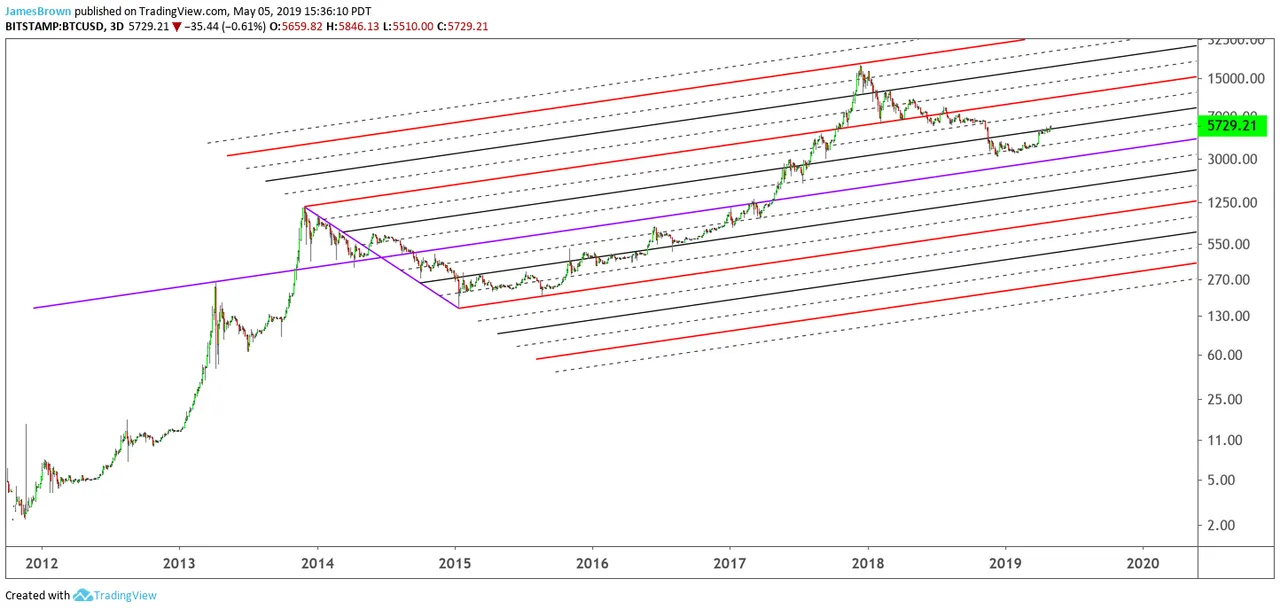
https://www.tradingview.com/x/LfDEIfiN/
Zoomed In 3D:
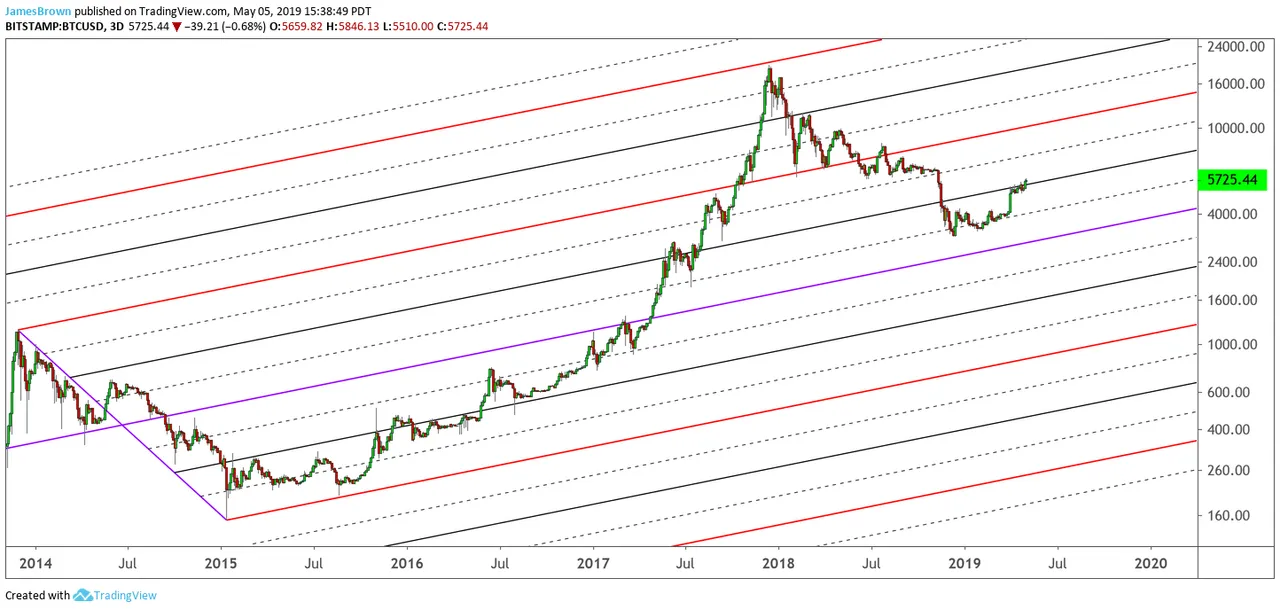
https://www.tradingview.com/x/NPXJPmmV/
Greater Zoom 1D:
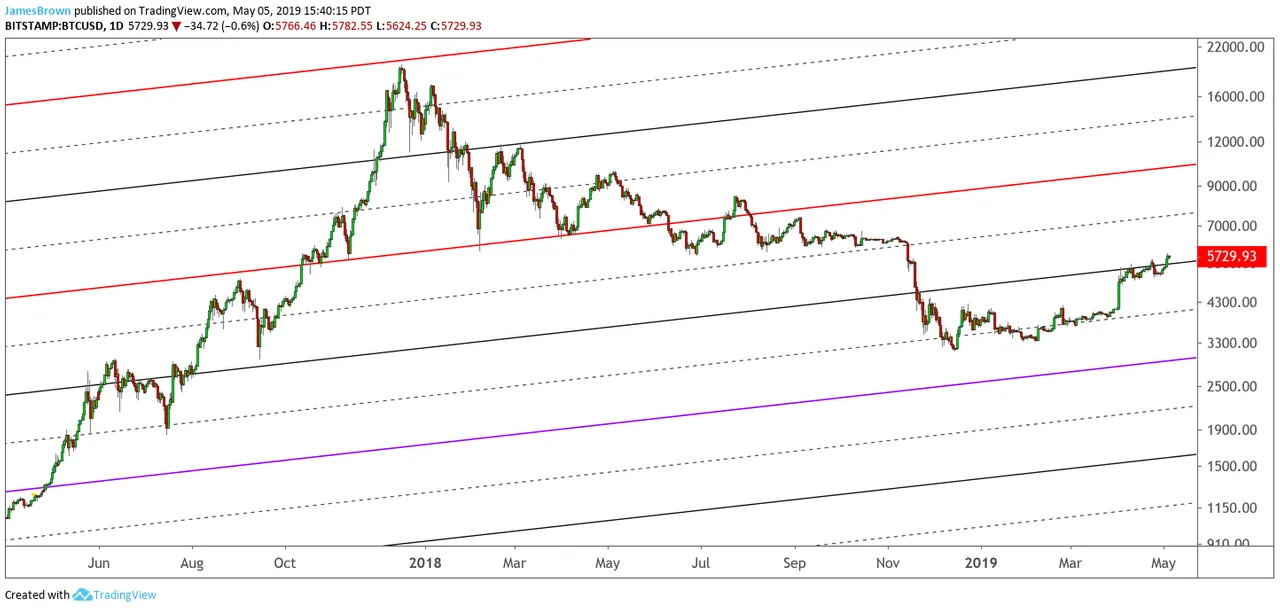
https://www.tradingview.com/x/3sp55FEt/
The more these lines seem to act as support/resistance and the more often the price action seems to respond "aggressively" to a break below or above them, the surer we can be that the pitchfork is valid (as in: it is useful in determining what price may do when the lines happen to come into play).
The idea here is that any line that has demonstrated a large amount of support or resistance to price in the past should, in theory, continue to have strength as a S/R line; therefore, we would expect that any "tests" of these lines in the future would be probable points in "price and time" to form a major price pivot (relative to the price at any random moment).
You can see by looking back on the historical data (in the above charts) that this has mostly been the case up until today. Whether or not this continues to hold true into the future remains to be seen, but we can be more and more confident that it will continue to work the more and more price continues to respect these lines. As long as it proves to be a tool that has some predictive value, we should keep it close by, even if it may take weeks or even months before it proves its usefulness. It can be costly to forget the value of this type of analysis when approaching a trade using other TA methods. As ever, confluence (of support/ resistance indicators) is our most valuable indicator of highly probable price behaviors.