The history with all that has happened and is happening with BTC today is in the following chart; with this I try to get a look at possibilities in the VERY near future about possible outcomes. Please keep in mind this is just a GAME OF PROBABILITIES.
Note: see previous post:
https://steemit.com/bitcoin/@indepthstory/simple-technical-analysis-on-btc-follow-up-to-previous-post
So again, I dare to say:
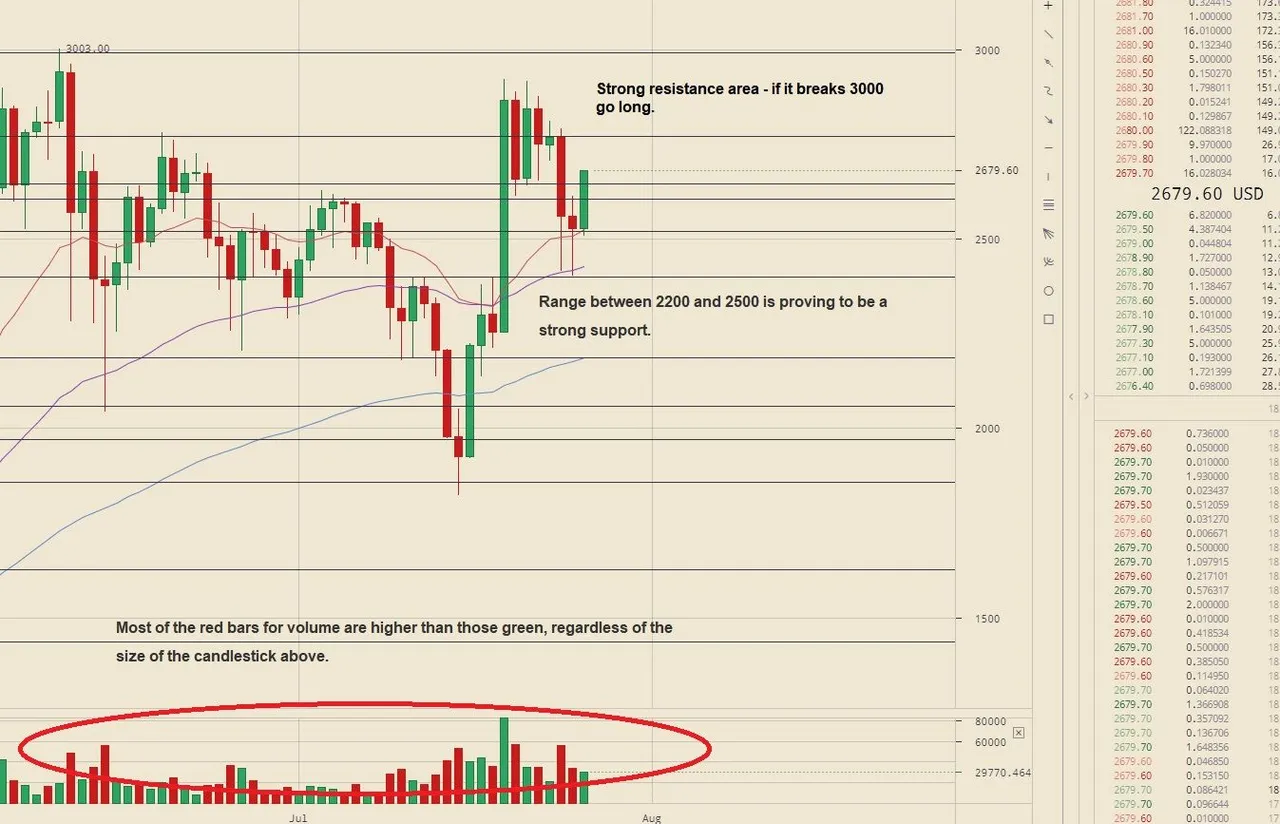
1 - The target of 3000 is still in the range of possibilities; although these are diminishing by the day. It is proving to be a strong resistance. Again, if it breaks 3000 get on, otherwise consider going short.
2 - The range between 2200 and 2500 is also proving to be a strong support.
3 - So, the range from 2200 to 3000 is proving every day that the market is in doubt; does not know what to do and perhaps is waiting for a signal which eventually will tell it where to go – to either buy, go short or stand aside.
4 - For the immediate term, days to max a couple of weeks, I think it has a higher possibility of going down to test the 1600 to 1800 support area. Why? Because of volume!! Except for the bar on July 19th, on every day, whether green or red height of candlestick is same, the number of transactions has been higher for the red than for the green, i.e. distribution, as in sell quietly and don’t tell anyone. This worries me.
Conclusion: I am standing on the sidelines.
Keep in mind and remember, as before I say, focus on what is in front of your nose:
S = support
R = resistance
V = volume
Are you into this type of topics, plus others like science, technology, human state, politics? Keep the conversation alive …. UPVOTE & perhaps, RESTEEM, and in addition you might want to click on the FOLLOW for further interesting posts. If visiting, please don’t leave without placing your comment(s).