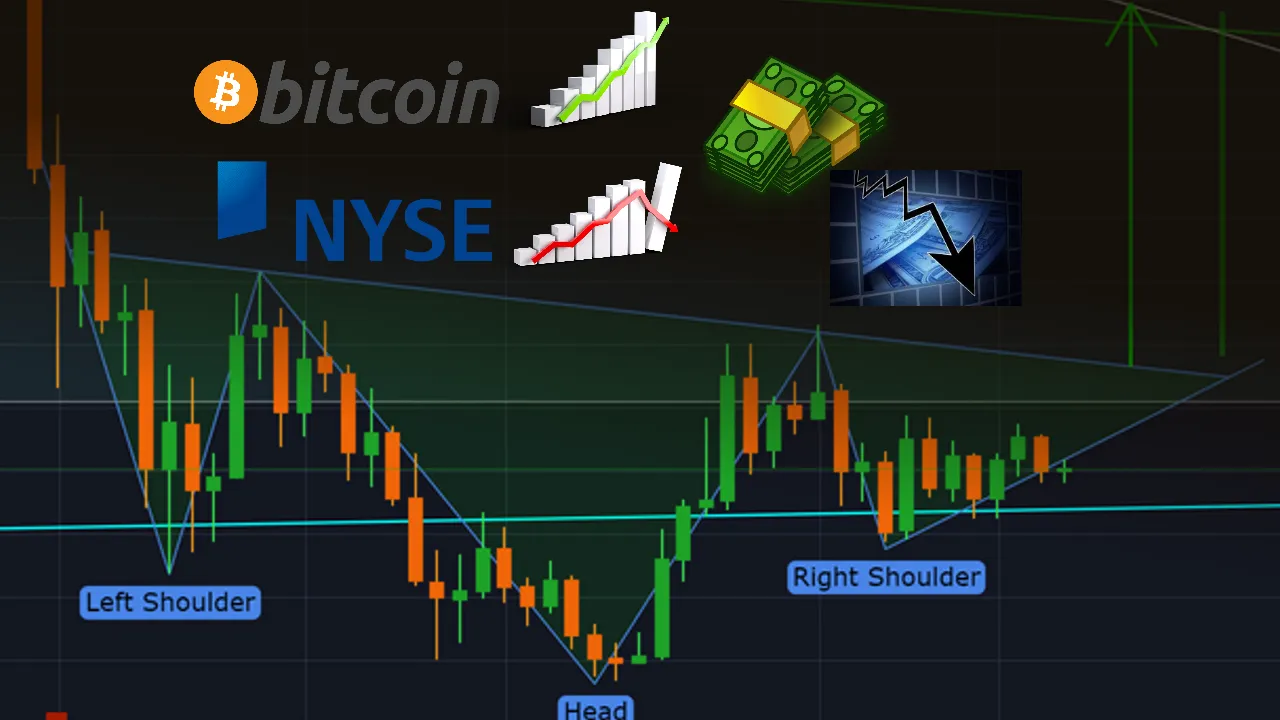
Inverse head and shoulders pattern leads to $5k+.
~450 day-long bullish divergence still holding up.
Daily MACD, RSI, and Stochastic are all decent.
The U.S. Dollar Currency index still bearish while the stock market is closing back in on it's official bear market barrier.
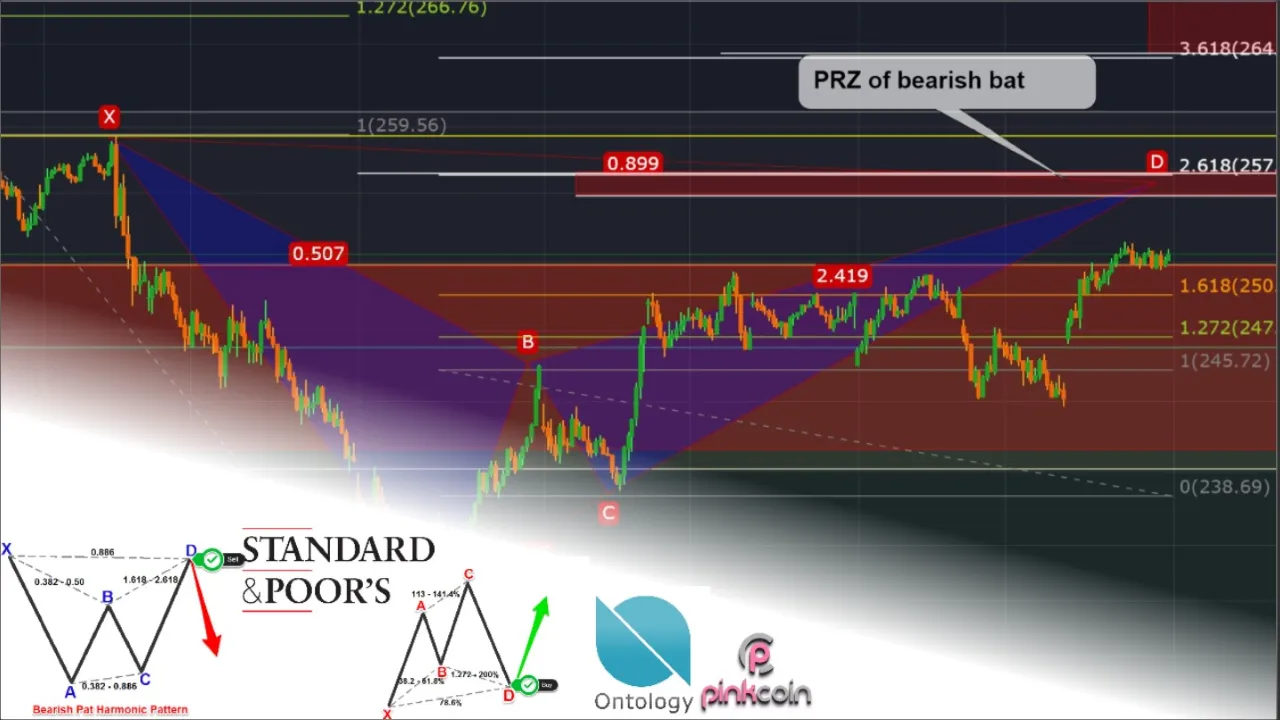
Watch the video(s) for much more detailed analysis, including updates on my unique charts that combine bitcoin's price data with other relevant price action from the traditional markets.
Video 1(January 3):
Video 2(January 4):
24/7 Livestream:
https://youtube.com/tomasssteven/live
-Tom(@MyEmpireOfShit)
Personal links: Twitter | Tradingview | YouTube | Twitch | Facebook
iDC INC's links: Facebook | Twitter