I see chart patterns which shows Bitcoin may have a rise, but what will be next then....? I can't say now, and no one else may be so sure as well.
let's check the pattern:
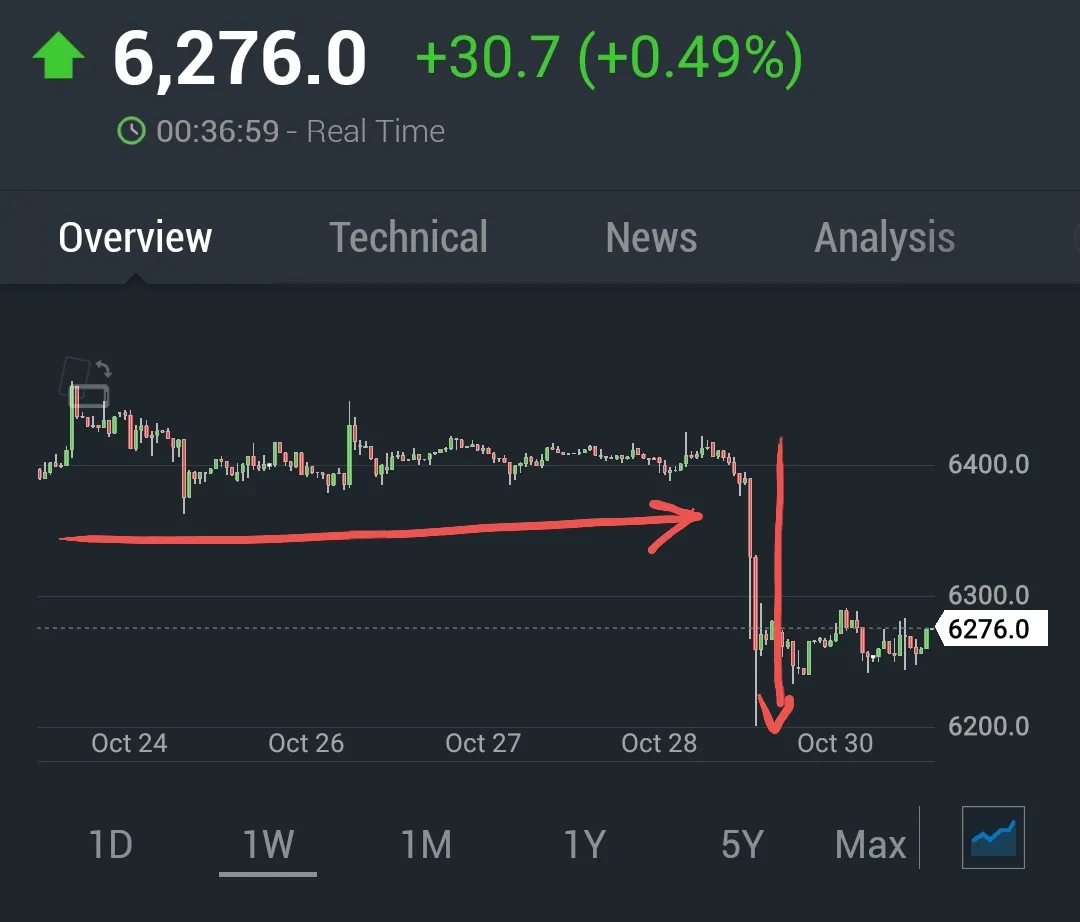
This is what you see now as the chart for last 7 days.
the sharp drop is to test again the $6200 support which would be confirmed to be broken if the candle could close below $6000, which didn't.
ok, deep breath!
now take a look at the chart for last 30 days:
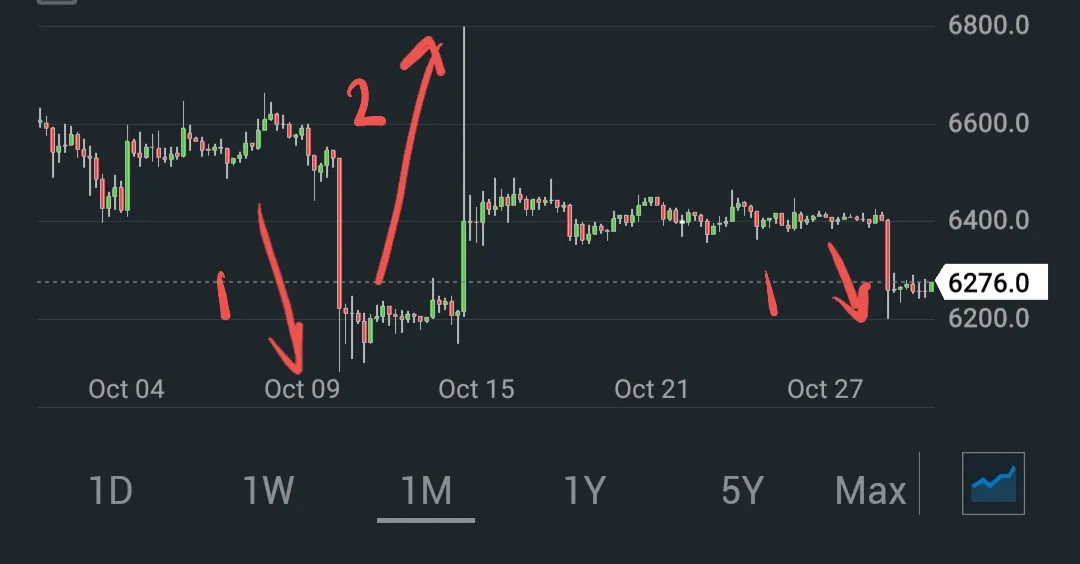
once the chart was in the sideways for a long time, a drop with no success on closing below the support level, resulted in a bull run to test the resistance level at $6800.
this can happen again.
now, what are the resistance levels above us?
- $6800 - 80% probability
- $7200 - 55%
- $7500 - 40%
- $8000 - 25%
this is not a financial advice, I just share my observation and thoughts on the market to learn from others. this is why I appreciate a lot all comments 🙇♂️