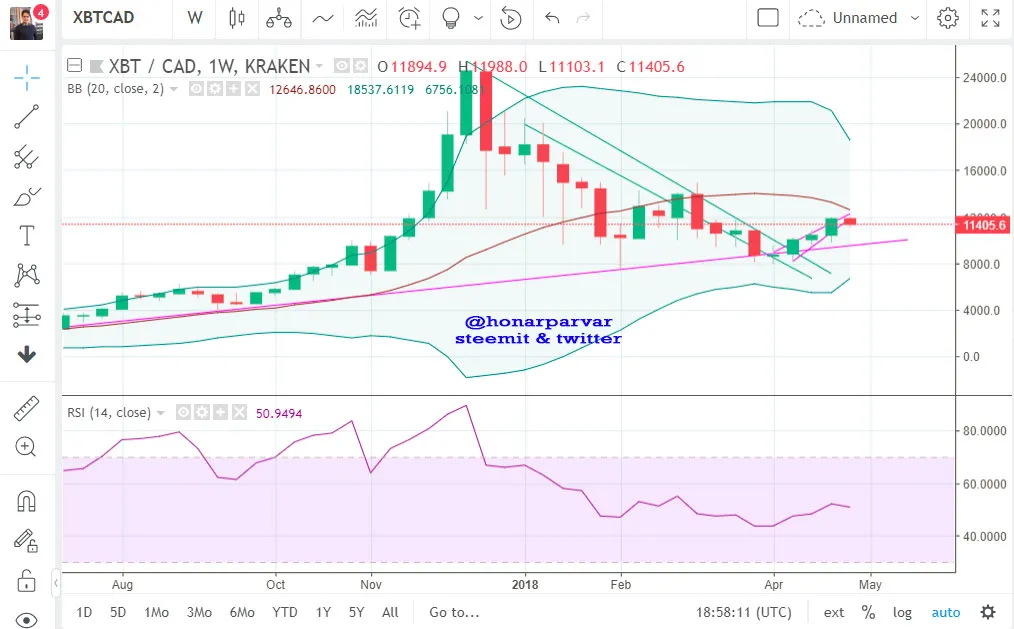
Bitcoin's uptrend may get challenged couple of days since the resistance held strong @ 11900 CAD
look at the one week chart:
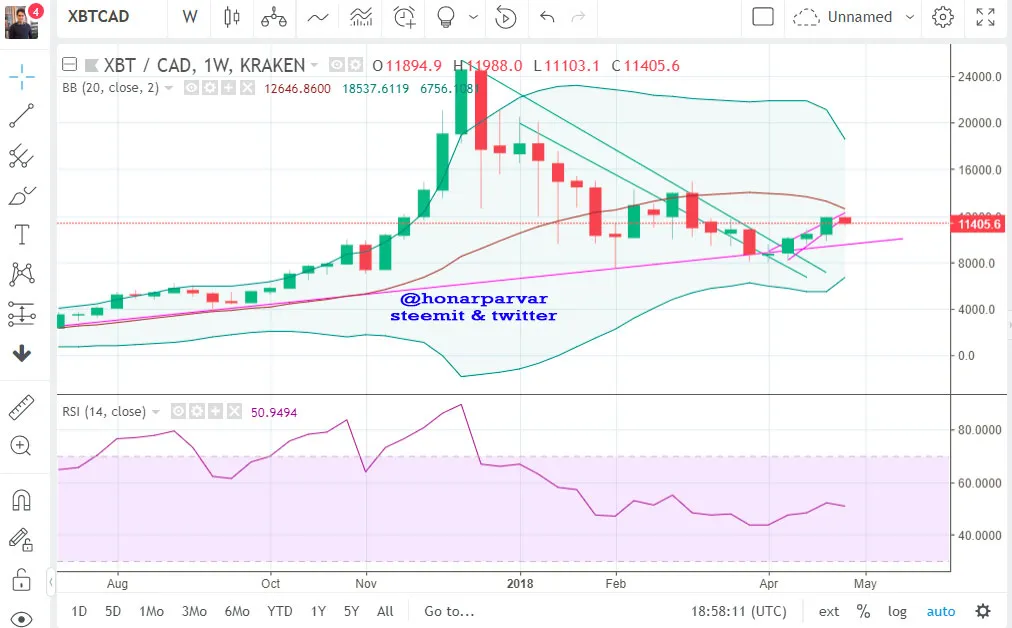
The support line (which confirms the uptrend) is still valid, the downtrend since 2017 Dec has ended and the new trend still holds. The Bollinger Bands and the RSI14 shows the uptrend can continue, but last week candle should be studied in smaller time period, as it is getting closed below support line.
so we go to daily chart below:
the good thing is the bollinger bands confirm uptrend, RSI may result in some correction but still potentially bullish.
what's next?
I believe some of the energy saved in bullish movement in recent weeks should be discharged. So we may have corrections:
- step one: 11200 CAD level, which I believe will be broken
- step two: 10000 CAD level, which is stronger, and I believe it is a good point to buy more in
- step three: if 10K fails to resist, 8300 CAD will be tested, if 10K doesn't fail, I believe we will see 14700 resistance level tested. fingers crossed!
I will buy in several steps. @ 10200CAD and if lower again in several stages.
BUT
should you do the same? I don't know! I'm not advising anyone. I'm just opening my thoughts to others, so we can learn more from each other in such contribution.
In the end everybody should be responsible for his own decisions.
good luck and stay juicy in your tradings ;)