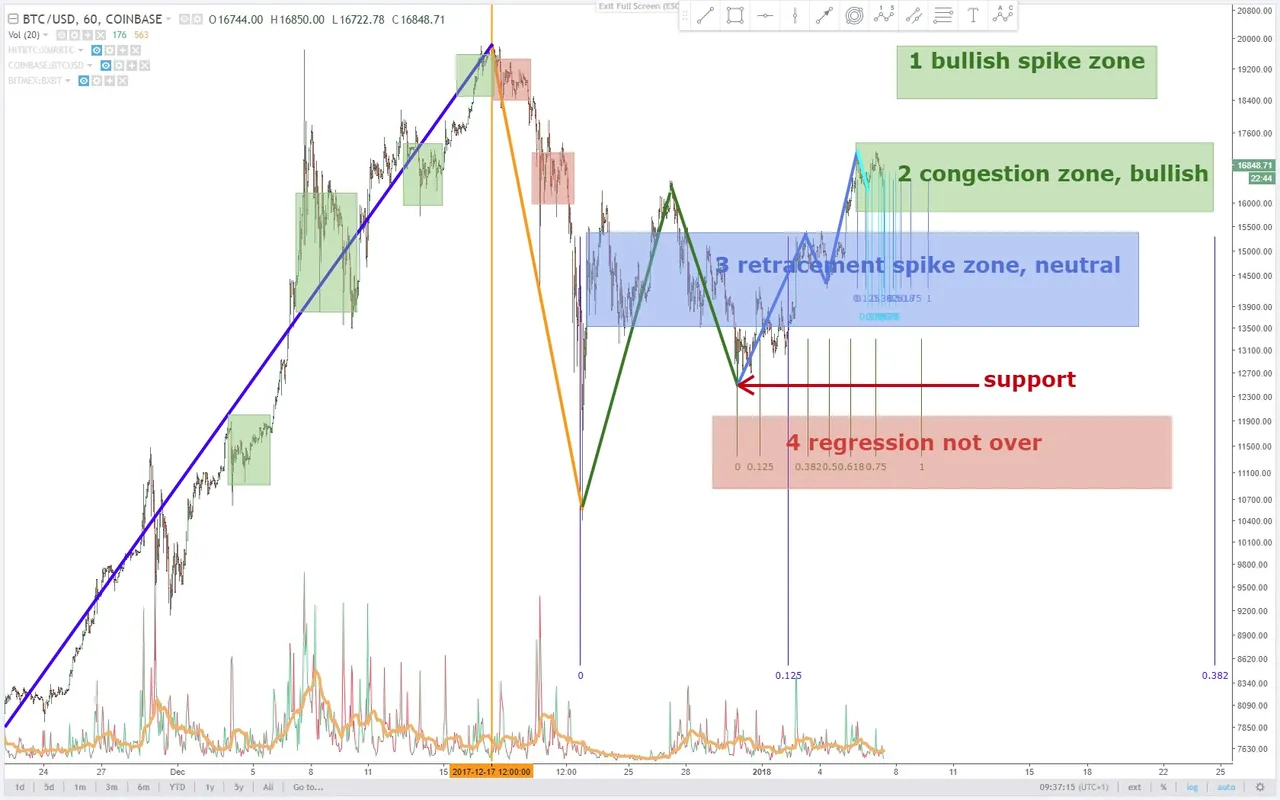
All the boxes in the diagram are congestion zones. They can serve for determining if the price has established a new level.
If the price spikes up to the zone 1 on top next, this is a bullish sign. The price will either rest in this zone then or fall back to the congestion zone 2, where it is now. But it will not stay in the blue blue zone 3 anymore.
If the price stays in the 2nd zone until tuesday, where it is now, this is bullish too. The price can still spike down to the blue zone 3, but will not fall any deeper anymore or idle around in zone 3.
If the price just returns to the blue zone 3 until tuesday and even begins to idle around there, zone 3 is bearish again. Spikes, testing the red support line can be expected then.
Should the price actually fall below the red support line next, it is very likely that the price will begin to idle around in zone 4. This is definitely bearish then and the price can be expected to spike even deeper, down to 10.000.