
SUMMARY
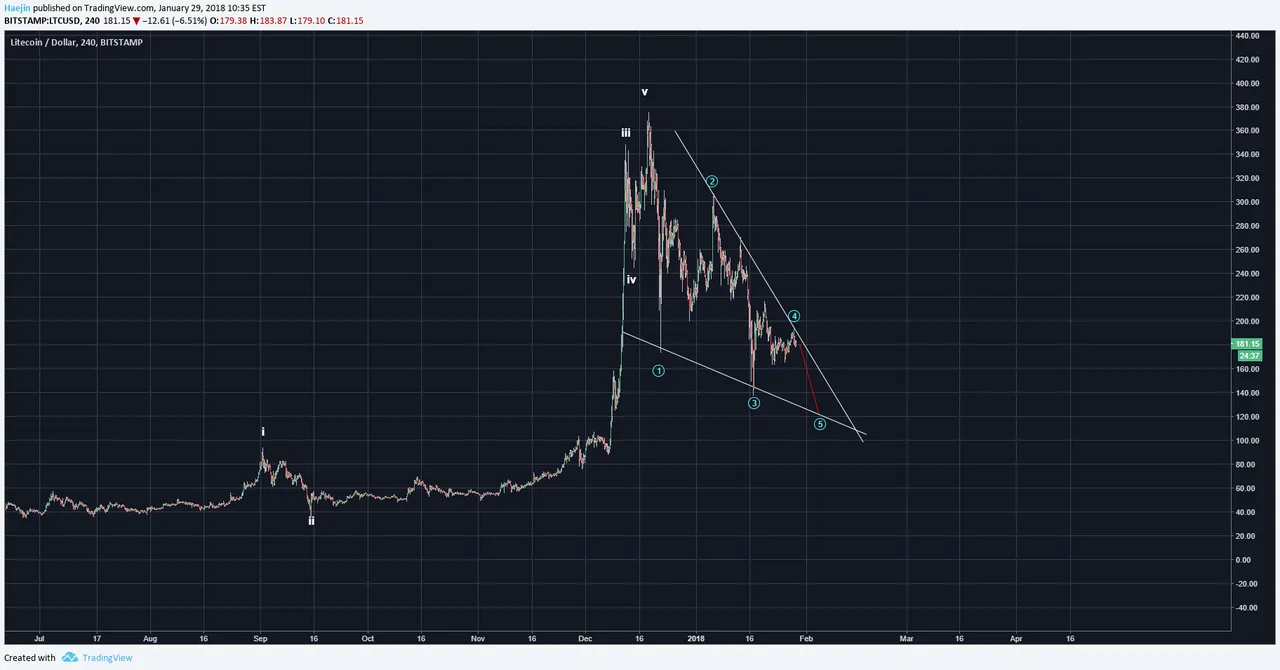
The below chart of LiteCoin (LTC) is quite impressively a near twin of Bitcoin (BTC). Across the Cryptosphere, sentiment is quite uniform during both the bull runs and the corrections. It's often called "All the Same Markets". The chart below shows a very nice impulse of five waves (white) followed by the blue 1,2,3,4,5. IF Bitcoin (BTC) leads down; LTC is expected to follow. The blue 5 woudl represent an attractive zone to cast a buy ladder.
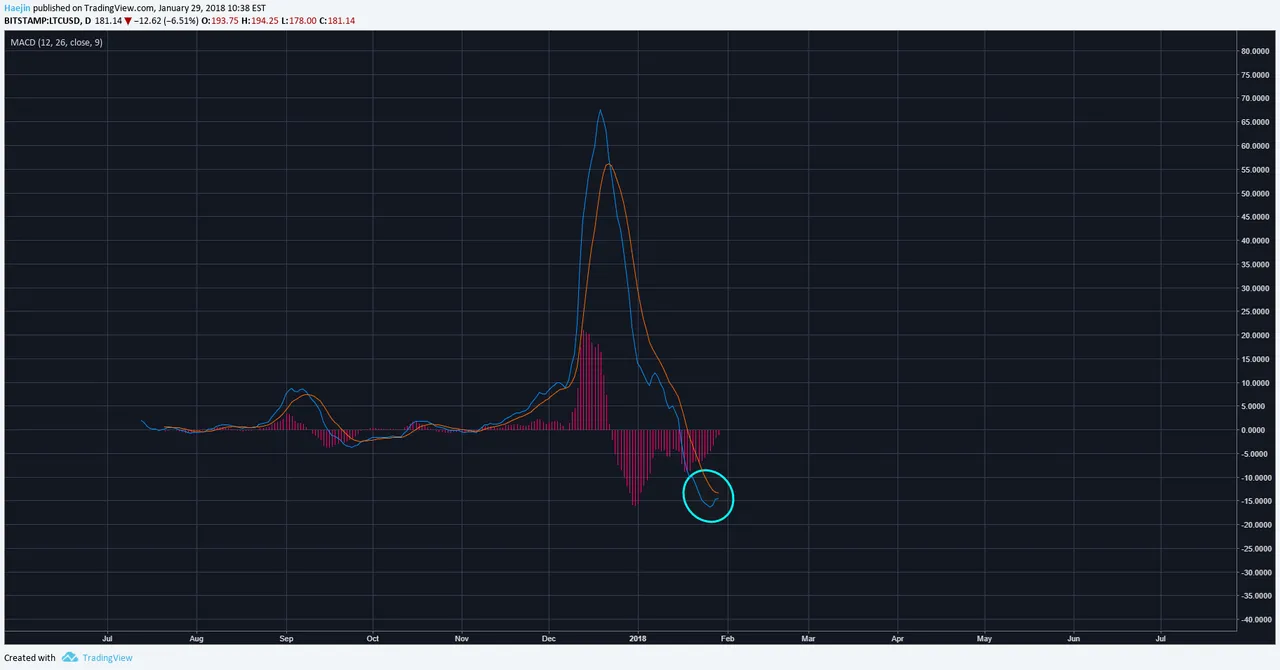
The MACD is oversold and the turn up of the 12 day moving average (blue) could glance the 26 day (red) rather than pierce upwards. This would jive well with the lower low that's expected.
Legal Disclaimer: This is only my opinion, make of it what you wish. What does this mean? It means it's not advice nor recommendation to either buy or sell anything! It's only meant for use as informative or entertainment purposes.
Please consider reviewing these Tutorials on:
Elliott Wave Counting Tutorial #1
Elliott Wave Counting Tutorial #2
Elliott Wave Counting Tutorial #3
Laddering and Buy/Sell Setups.
Laddering Example with EOS
Tutorial on the use of Fibonacci & Elliott Waves
@haejin's Trading Nuggets
Essay: Is Technical Analysis a Quantum Event?
Follow me on Twitter for Real Time Alerts!!
Follow me on StockTwits for UpDates!!
--
--

If this blog post has entertained or helped you to profit, please follow, upvote, resteem and/or consider buying me a beer:
BTC Wallet - 1HMFpq4tC7a2acpjD45hCT4WqPNHXcqpof
ETH Wallet - 0x1Ab87962dD59BBfFe33819772C950F0B38554030
LTC Wallet - LecCNCzkt4vjVq2i3bgYiebmr9GbYo6FQf
