
SUMMARY
IOTA completed five Elliott Waves up and as a requisite correction, is patterning the very common triangle as shown below. The MACD 12 day moving average line (white) is curling up and about ready to cross above the slower moving red 26 day moving average. IF the blue waves play out, the d wave would complete and with a subsequent minor wave down; the e wave. By then, the MACD would have well generated a buy signal that could have signficant impulse effect upwards.

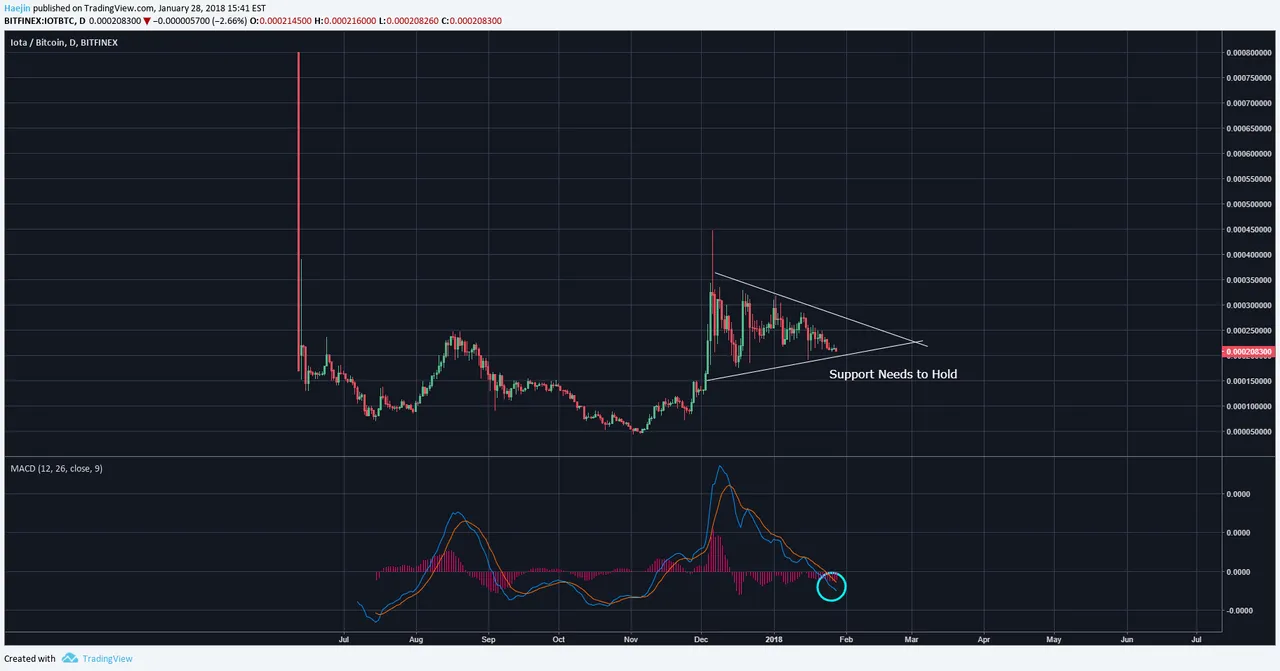
The IOTA/BTC is lagging the /USD pair. The MACD is not yet curling upwards but the triangle pattern is uncanny. The bottom line of the triangle needs to hold as support in order for the pattern to complete and confirm. Remember, the /BTC pairs often lag the /USD pair because it has two variable; change in demand for the Altcoin and the change in BTC price. The /USD pair only has a single variable; the change in the demand for the coin.
Legal Disclaimer: This is only my opinion, make of it what you wish. What does this mean? It means it's not advice nor recommendation to either buy or sell anything! It's only meant for use as informative or entertainment purposes.
Please consider reviewing these Tutorials on:
Elliott Wave Counting Tutorial #1
Elliott Wave Counting Tutorial #2
Elliott Wave Counting Tutorial #3
Laddering and Buy/Sell Setups.
Laddering Example with EOS
Tutorial on the use of Fibonacci & Elliott Waves
@haejin's Trading Nuggets
Essay: Is Technical Analysis a Quantum Event?
Follow me on Twitter for Real Time Alerts!!
Follow me on StockTwits for UpDates!!
--
--

If this blog post has entertained or helped you to profit, please follow, upvote, resteem and/or consider buying me a beer:
BTC Wallet - 1HMFpq4tC7a2acpjD45hCT4WqPNHXcqpof
ETH Wallet - 0x1Ab87962dD59BBfFe33819772C950F0B38554030
LTC Wallet - LecCNCzkt4vjVq2i3bgYiebmr9GbYo6FQf
