
SUMMARY
The prior ascending triangel pattern with a target of $373 attained only $355. I explain profit protection using trailing STOPs. The below chart is an updated combination of Elliott Waves and Chart Pattern. The blue circled numbers, 1,2,3,4,5 represent solid impulse motive which is followed by a requisite retracement. Elliott waves has three types of retracements; the zig zag otherwise known as the 5,3,5 and the flat, also known as 3,3,5. The third is a triangle and the below chart labels an a,b,c,d,e triangle. Wave e is not yet complete and this means a likely dip towards $291 or so. From there, prices should start impulsing up in five waves. These a,b,c,d,e triangle types have directional bias for up when the e wave ends at the bottom triangle line.
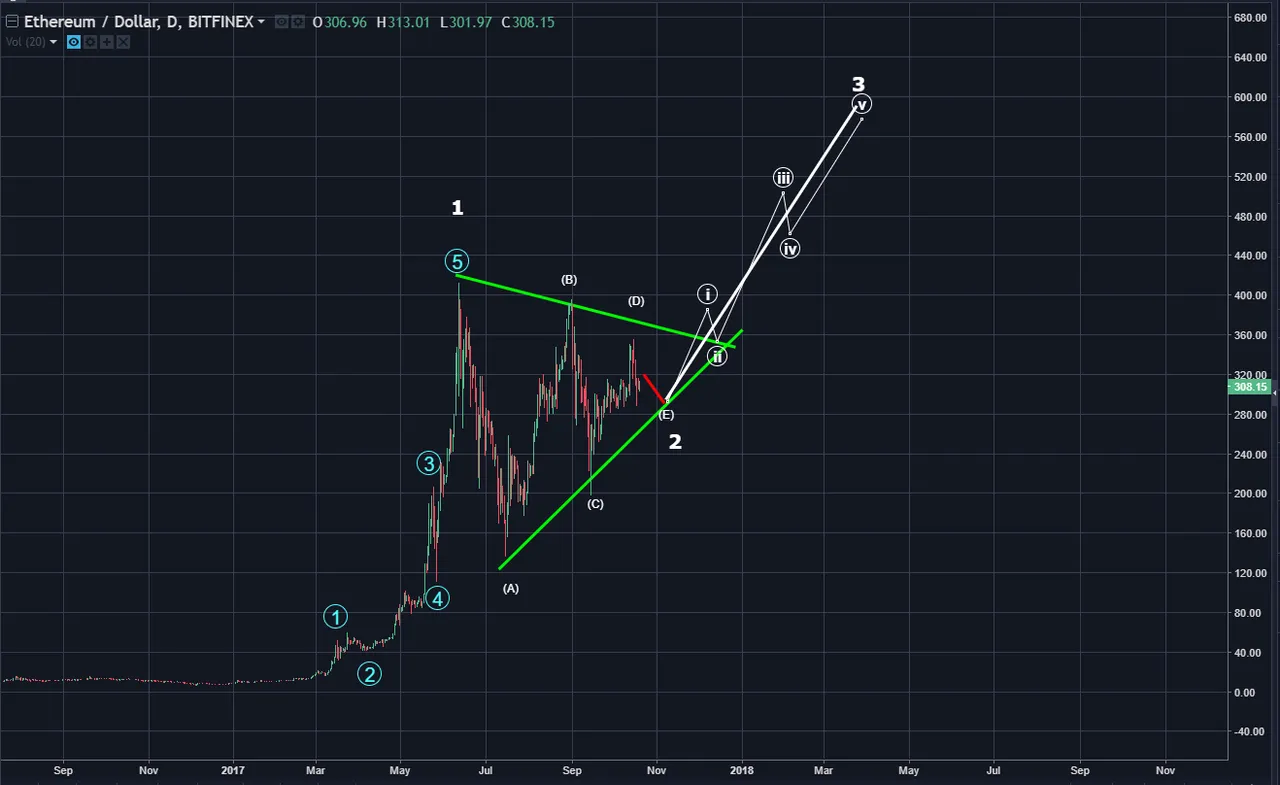
The long term perspective lies in the white numbered wave 1 and 2 because after waves 1 and 2...wave 3 is next. In this case wave 3 is UP which means higher highs are expected.
--

If this blog post has entertained or helped you to profit, please follow, upvote, resteem and/or consider buying me a beer:
BTC Wallet - 15ugC4U4k3qsxEXT5YF7ukz3pjtnw2im8B
ETH Wallet - 0x1Ab87962dD59BBfFe33819772C950F0B38554030
LTC Wallet - LefeWrQXumis3MzrsvxHWzpNBAAFDQbB66

Legal Mumbo Jumbo: This is only my opinion, make of it what you wish. What does this mean? It means it's not advice nor recommendation to either buy or sell anything! It's only meant for use as informative or entertainment purposes.**