
SUMMARY
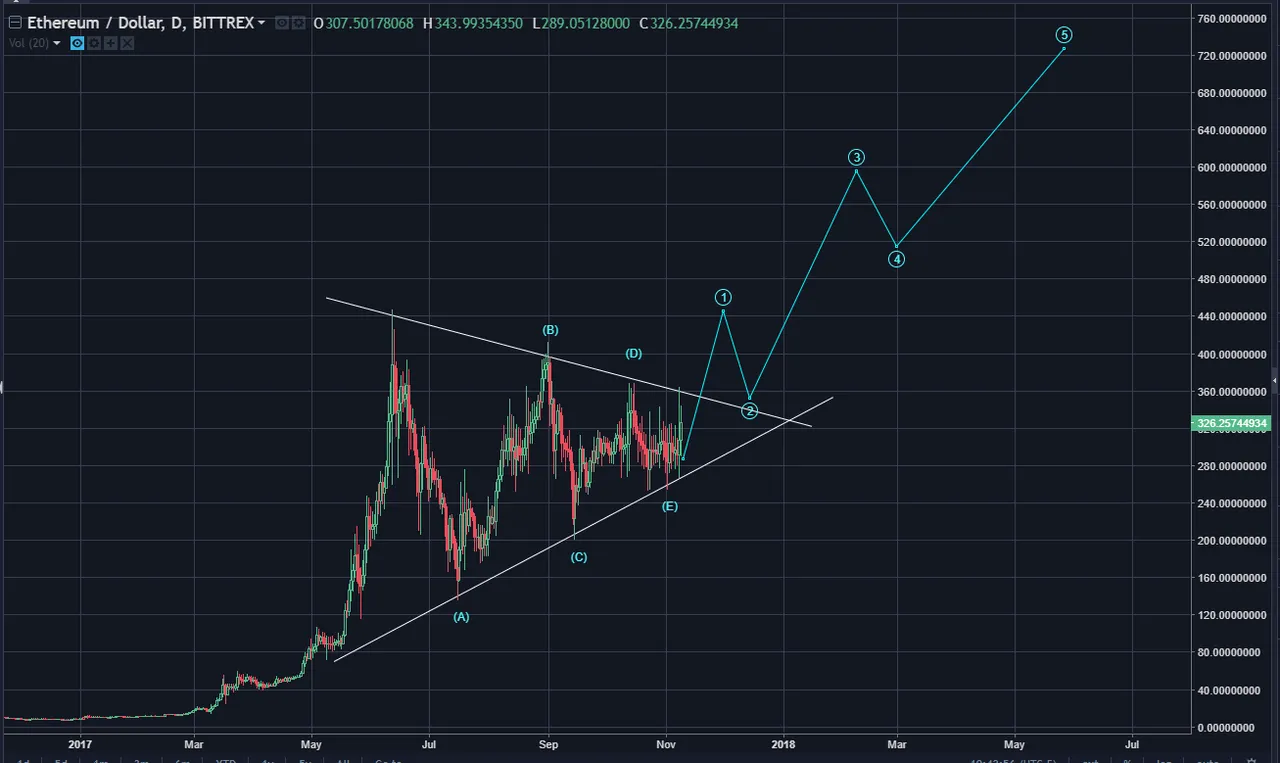
Ethereum (ETH) had been bound within the boundaries of a triangle as shown in below chart. The pattern is thus very clear and Elliott Waves labels this triangle as an a,b,c,d,e type. When the e wave ends at the bottom support line of the triangle, the pattern portends an upside direction. This is exactly the case with ETH. I've also labeled the Elliott Wave price pathway with circled blue numbers, 1,2,3,4,5. The next key step is for price to breach the upper resistance line of the triangle at around $359. As you can see, there was a brief pierce and I believe it's only a matter of little time before ETH is clearly into the $400 range with a target of $720!
Please consider reviewing these Tutorials on:
Elliott Wave Counting Tutorial
Laddering and Buy/Sell Setups.
Tutorial on the use of Fibonacci & Elliott Waves
These Technical Analysis Books: Elliott Wave Priniciple & Technical Analysis of Stock Trends are highly recommended
--
--

If this blog post has entertained or helped you to profit, please follow, upvote, resteem and/or consider buying me a beer:
BTS Wallet - d2e60e9856c36f34
BTC Wallet - 15ugC4U4k3qsxEXT5YF7ukz3pjtnw2im8B
ETH Wallet - 0x1Ab87962dD59BBfFe33819772C950F0B38554030
LTC Wallet - LefeWrQXumis3MzrsvxHWzpNBAAFDQbB66

Legal Mumbo Jumbo: This is only my opinion, make of it what you wish. What does this mean? It means it's not advice nor recommendation to either buy or sell anything! It's only meant for use as informative or entertainment purposes.**