
SUMMARY
Bitcoin (BTC) overnight action has been staging what should be a minor correction. I don't beleive we are in a crash scenario. Is it possible? Yes. But, to a Technical Analyst, possible and probable are very different.
The below chart shows three pretty close pathways with likely same destination. Price so far seems to be adhereing to the blue but I believe the white would be most bullish as it'll wash out the weak hands; hence be more like a buoy that rises after temporary immersion. The Yello pathway would be next bullish because price will sit on prior resistance as support which can give the impetus for the next leg up.
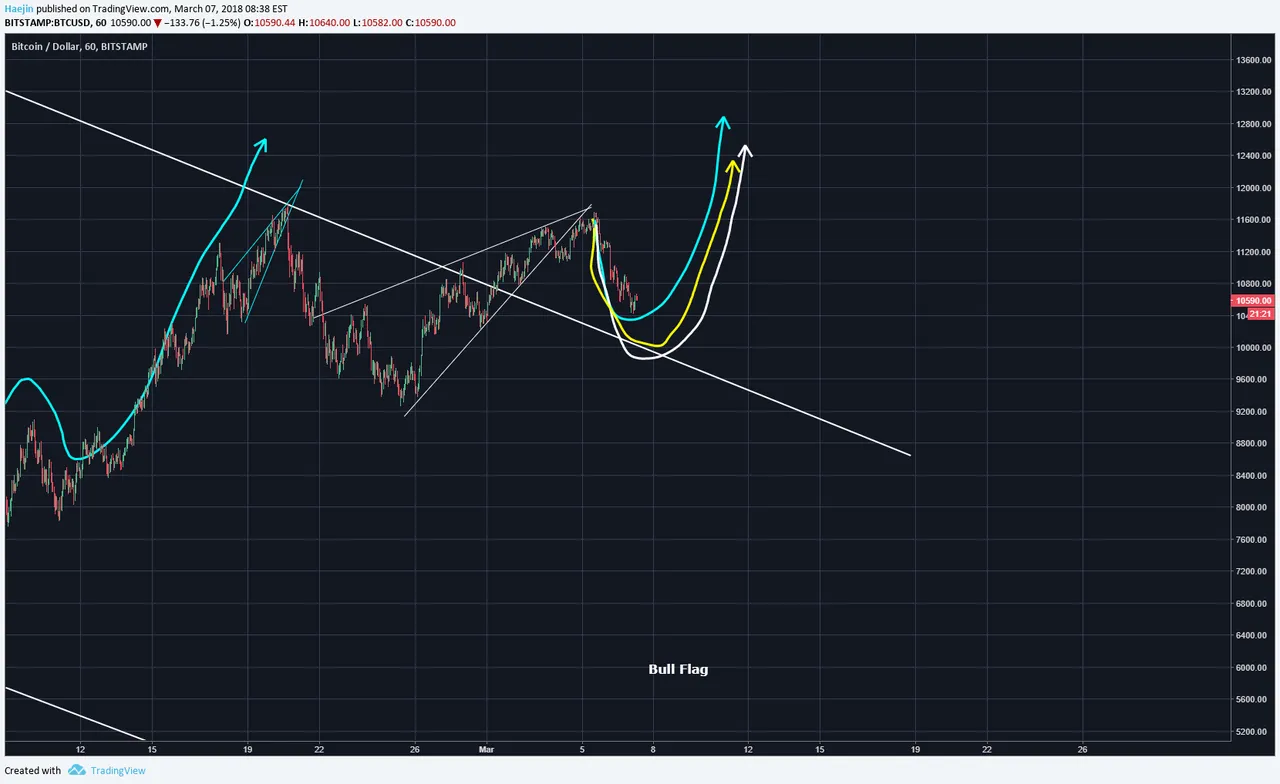
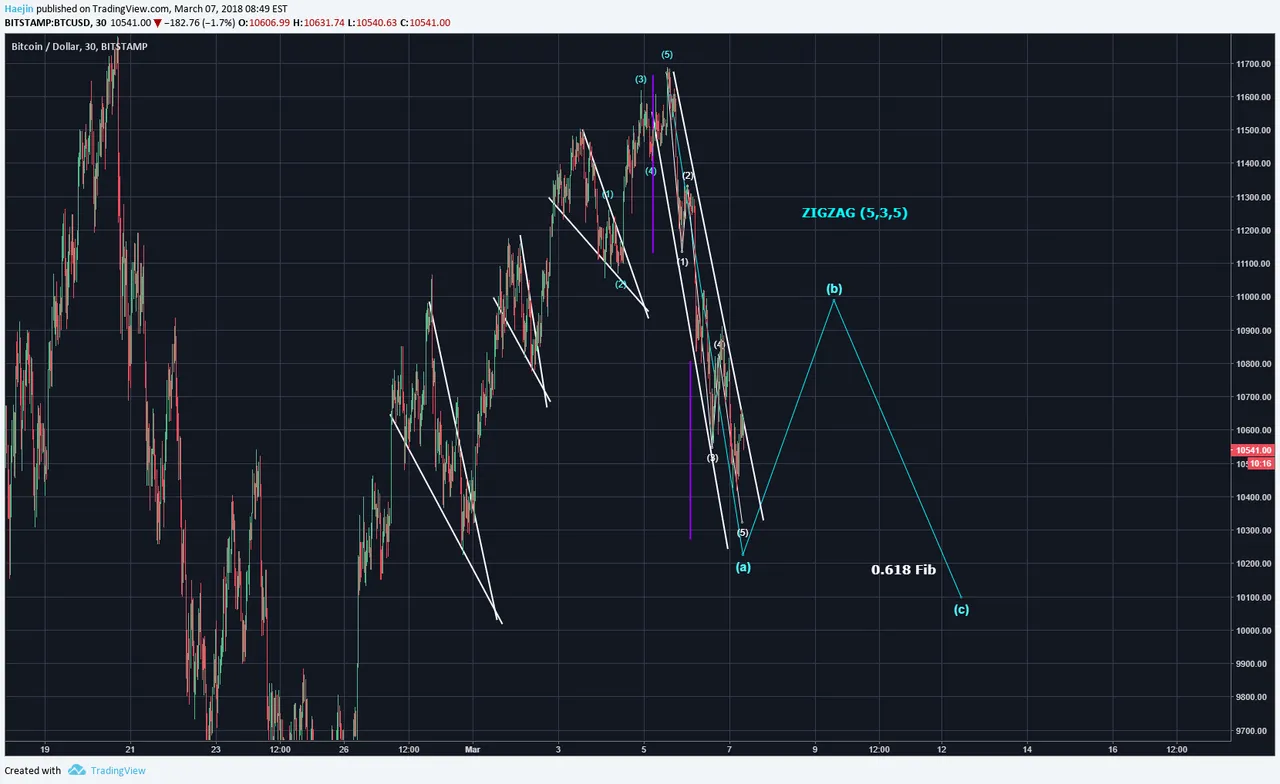
Chart closeup shows that the correction thus far has been travelig well within two parallel lines. When this happens, then price is impulsing, a very good indicator to use. I've lowered the white wave 5 to around $10,300 or so. Likely from there, the blue (a) wave will complete and (b) will be ready to onset. The purple vertical lines show that waves 1 and 5 are about equal; and when wave 3 extends, 1 adn 5 tend toward equality.
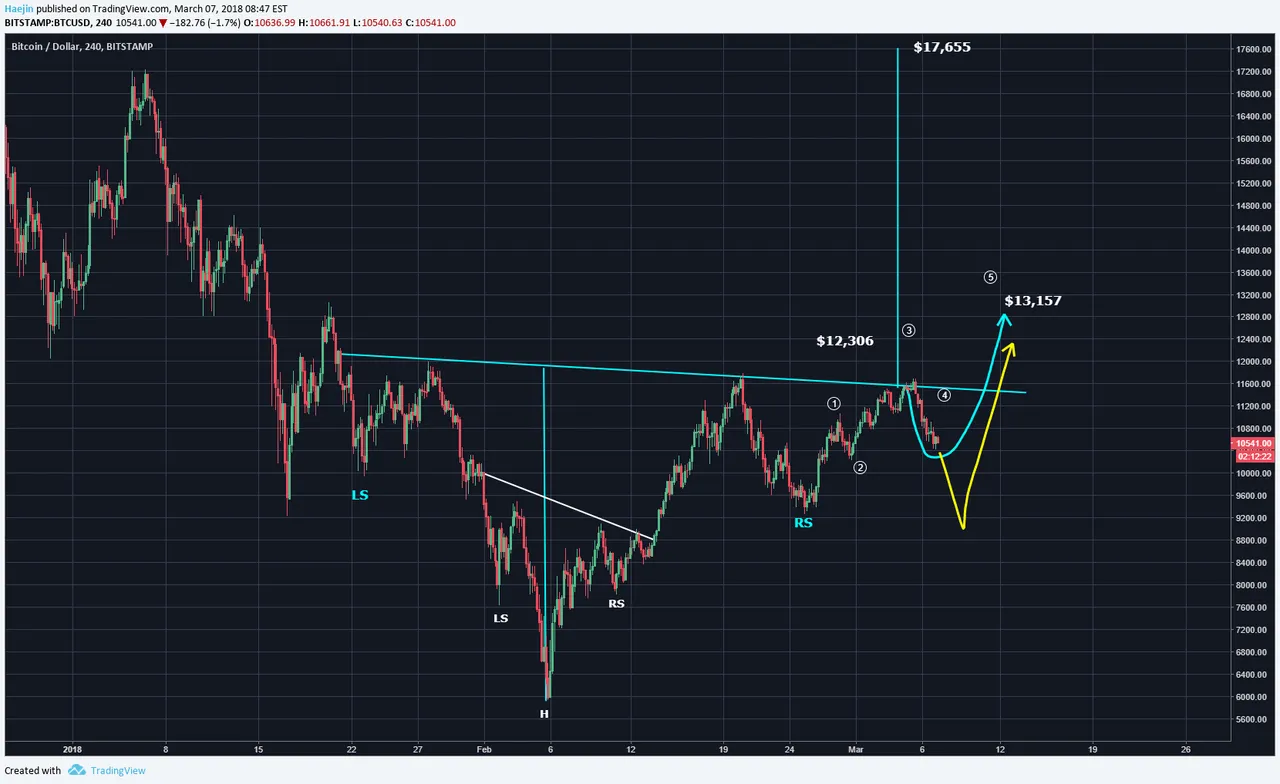
The larger picture of the Inverted H&S pattern still holds. Yes, the symmetry from the left and the right is getting farther apart. Let's see how the daytime price plays out. Is the yellow line pathway possible? Yes. It could also provide symmetry to the left side. However, it is not a top alternate for me yet.
Legal Disclaimer: I am not a financial advisor nor is any content in this article presented as financial advice. The information provided in this blog post and any other posts that I make and any accompanying material is for informational purposes only. It should not be considered financial or investment advice of any kind. One should consult with a financial or investment professional to determine what may be best for your individual needs. Plain English: This is only my opinion, make of it what you wish. What does this mean? It means it's not advice nor recommendation to either buy or sell anything! It's only meant for use as informative or entertainment purposes.
Please consider reviewing these Tutorials on:
Elliott Wave Counting Tutorial #1
Elliott Wave Counting Tutorial #2
Elliott Wave Counting Tutorial #3
Laddering and Buy/Sell Setups.
Laddering Example with EOS
Tutorial on the use of Fibonacci & Elliott Waves
@haejin's Trading Nuggets
Essay: Is Technical Analysis a Quantum Event?
Follow me on Twitter for Real Time Alerts!!
Follow me on StockTwits for UpDates!!
--
--

