
SUMMARY
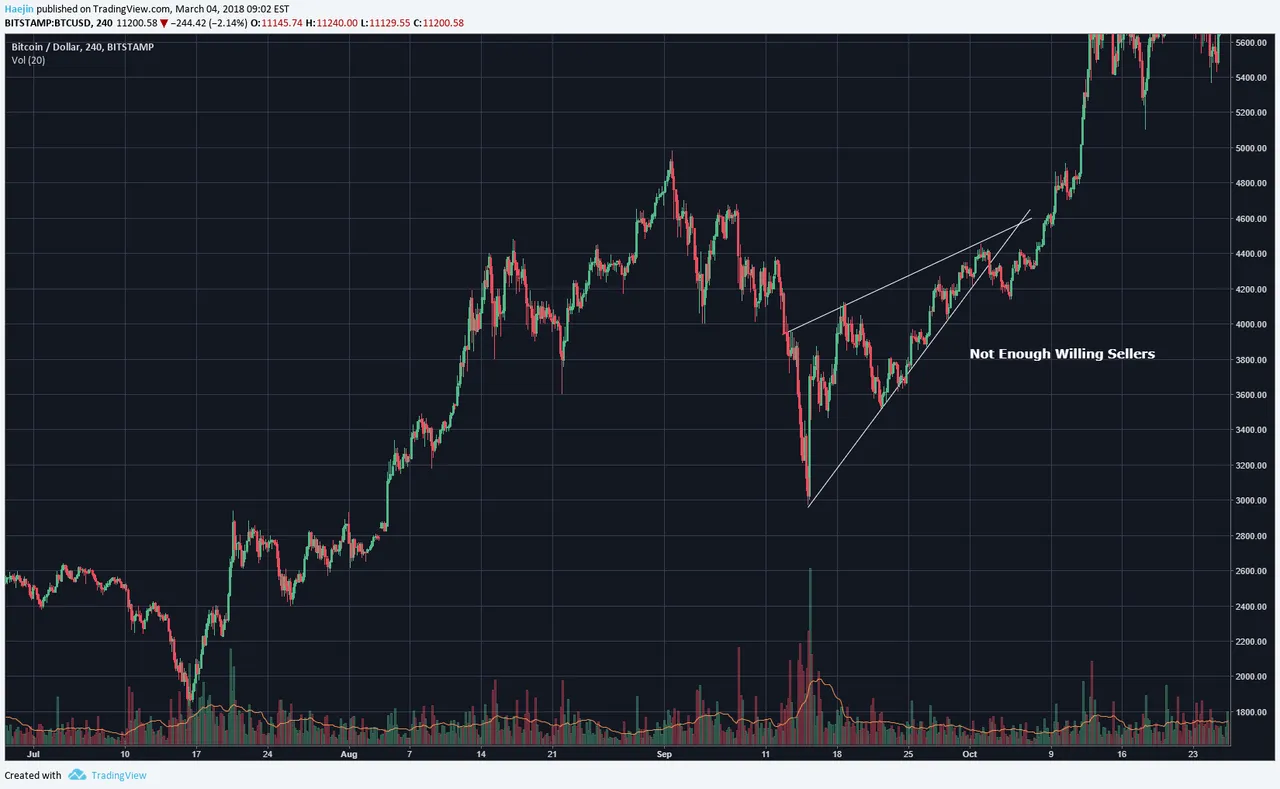
While the past is no guarantee of future performance, fractal impacts do linger. To this end, I wanted to share some attributes of the September 2017 correction and how it could have some fractal influences to this current recovery. The September correction showed an upward pointing wedge as shown in below chart. This type of wedge has bearish implications and usually the gudiance is that price can fall below the starting point. However, given how hard the sellers tried to beat down Bitcoin; they had depleted all their bullets. And even into this upward wedge; the seller repletion just was not enough to fulfill the wedge price travel guidance. I believe a wider scoped perspective always prevents myopia.
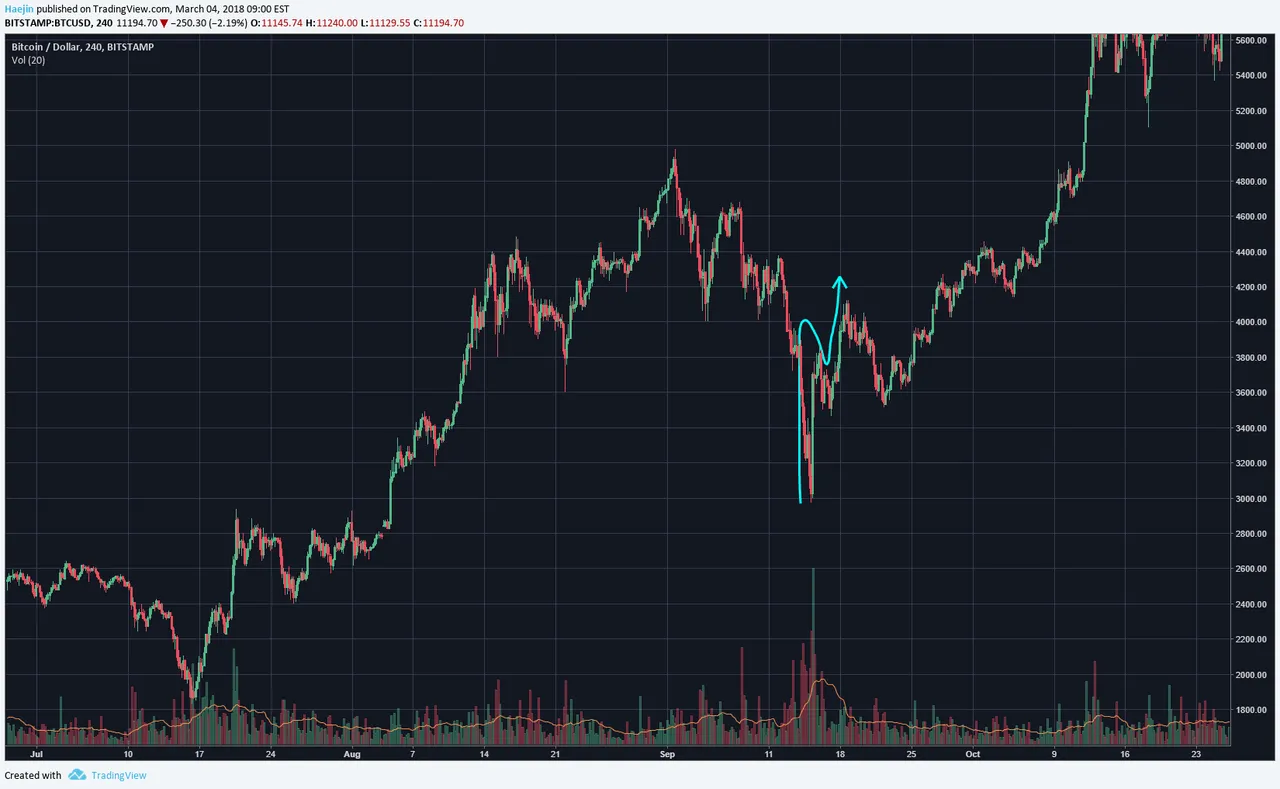
The early recovery of the September correction also looked very corrective in that it seemed very three wavish. The blue arrow shows how any good Technical Analyst might call it a bounce awaiting a lower low. But even at this early stage of the bounce, not enough sellers were populated so that price had to go up.
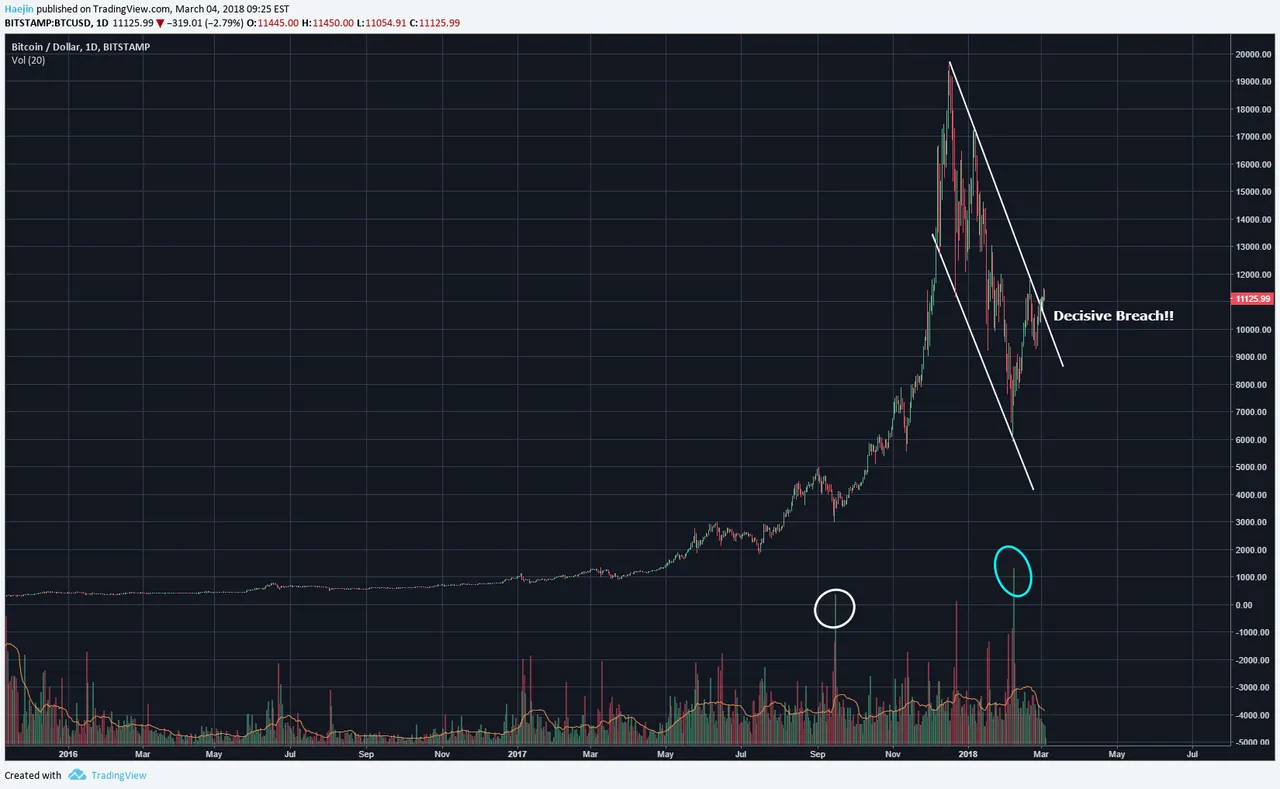
The recovery from the recent correction first started with a monstrous green volume, as it did for the September bottom mark. This is significant because it confirmed the depletion of sellers to the extent that basically not a seller could be found.
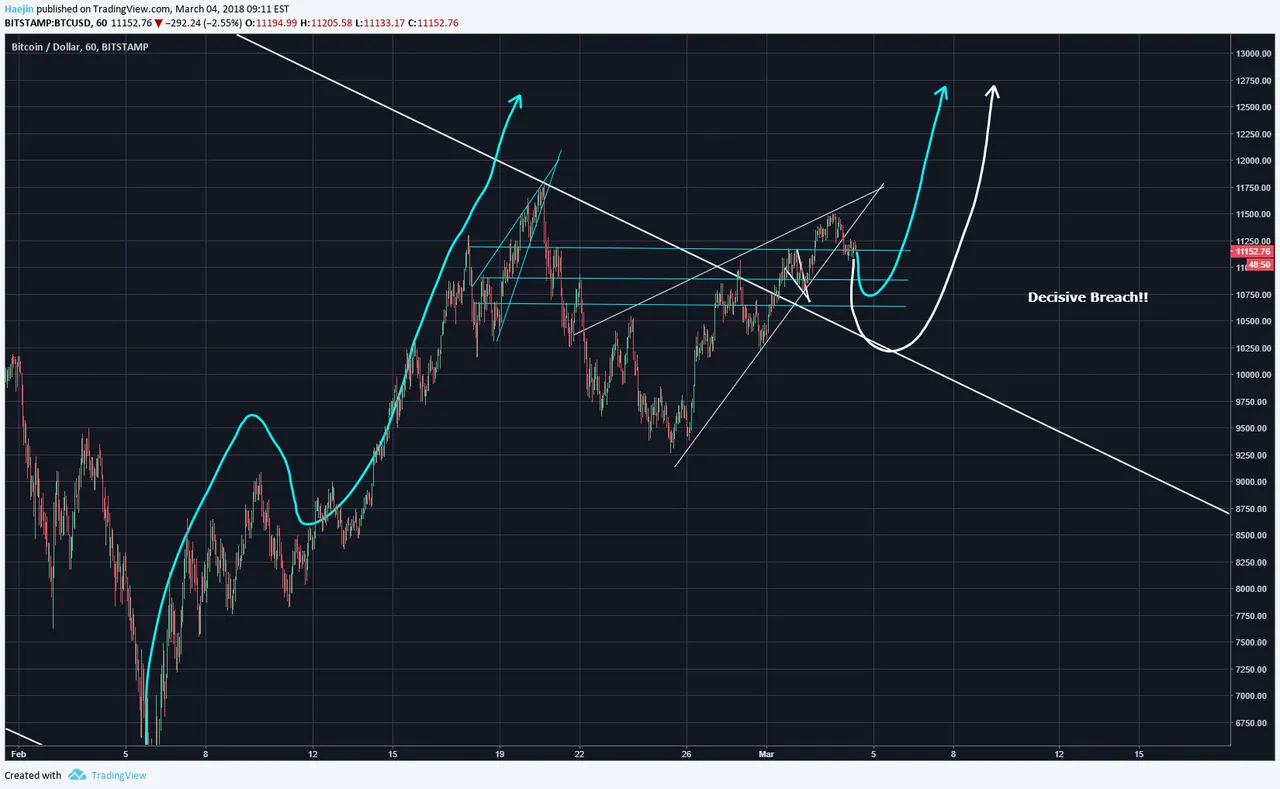
The initial recovery from the $5,900 bottom also looked very three wavish. It seemed very corrective and not impulsive. When price neared the upper white line, I had posted a critical juncture alert and noted the significance of breaching the upper white trend line. The breach occurred and thus far remains decisive.
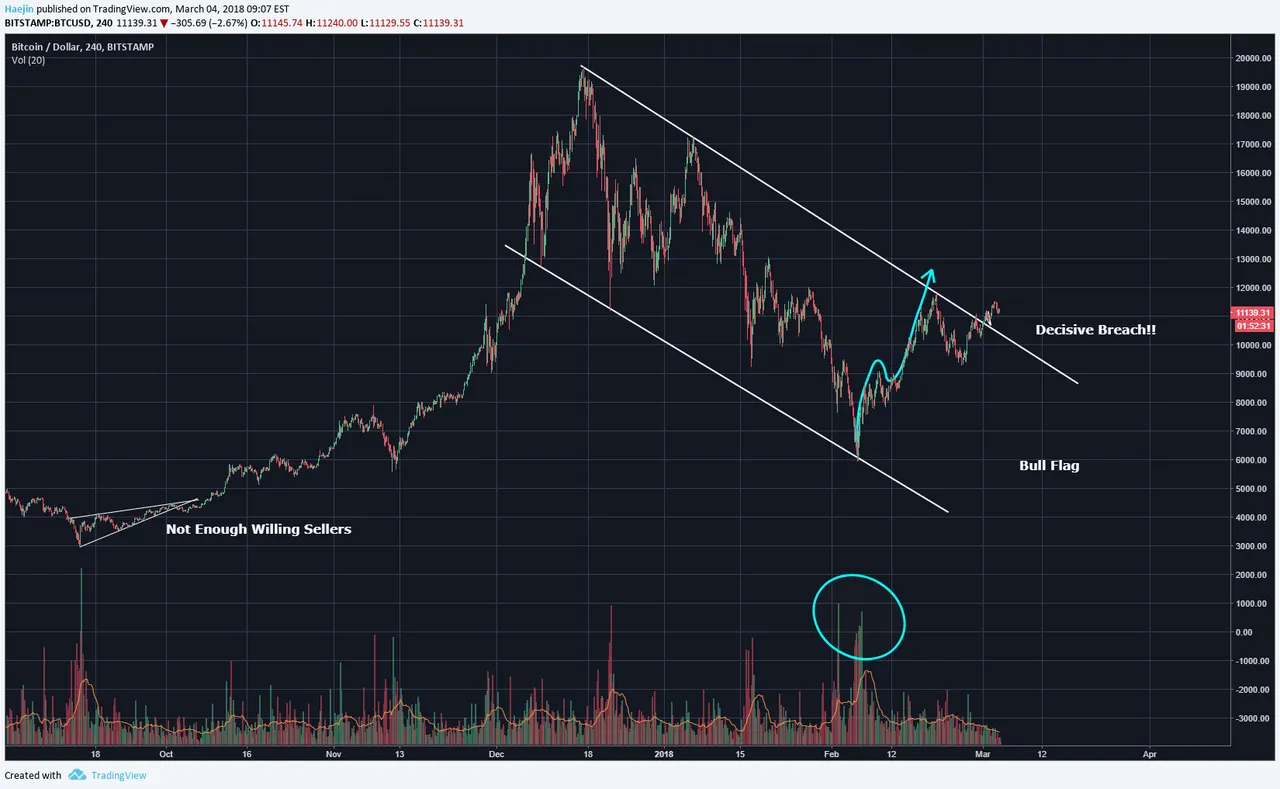
Here also, similar to the September correction, is an upward wedge. It's most probable that there is not enough repletion of sellers to drive price to below the starting point of the wedge pattern. The horizontal blue lines show the presence of good support and the upper white trend line now also represents strong support. The blue and white arrowed lines project likely price pathways for the next few days. IF price goes below the upper white trendline and stays there, then we have a different scenario and analysis will be updated.

Legal Disclaimer: I am not a financial advisor nor is any content in this article presented as financial advice. The information provided in this blog post and any other posts that I make and any accompanying material is for informational purposes only. It should not be considered financial or investment advice of any kind. One should consult with a financial or investment professional to determine what may be best for your individual needs. Plain English: This is only my opinion, make of it what you wish. What does this mean? It means it's not advice nor recommendation to either buy or sell anything! It's only meant for use as informative or entertainment purposes.
Please consider reviewing these Tutorials on:
Elliott Wave Counting Tutorial #1
Elliott Wave Counting Tutorial #2
Elliott Wave Counting Tutorial #3
Laddering and Buy/Sell Setups.
Laddering Example with EOS
Tutorial on the use of Fibonacci & Elliott Waves
@haejin's Trading Nuggets
Essay: Is Technical Analysis a Quantum Event?
Follow me on Twitter for Real Time Alerts!!
Follow me on StockTwits for UpDates!!
--
--

