
SUMMARY
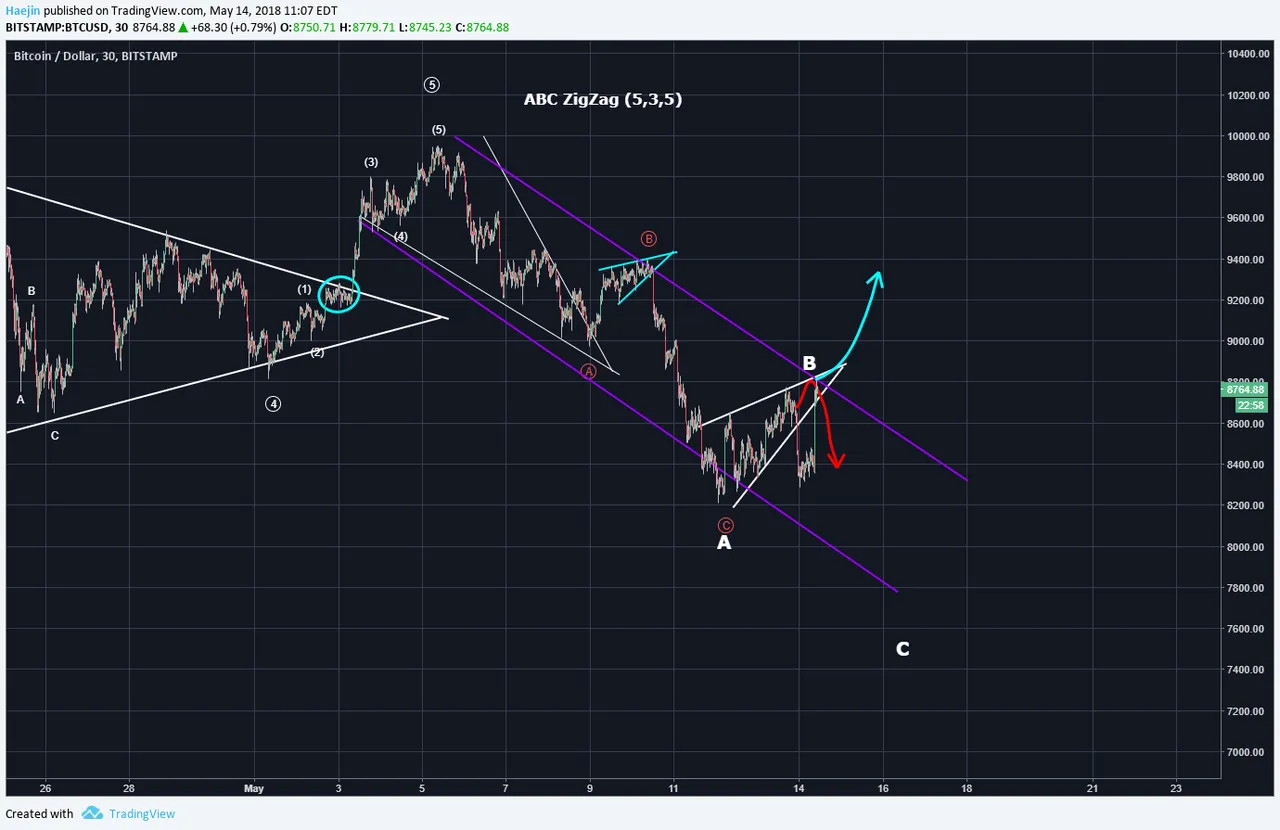
Bitcoin (BTC) overnight broke through the upward wedge and has now bounced back within the pattern as shown in below chart. I've drawn trendlines (purple) across the tops and bottoms o fthe price correction. The point where the upper white line of the wedge intersects the purple is where the price is currently. IF it can decisively breach that point as shown by the blue arrow, it would be bullish. However, I still feel the correction as the red ABC is a bit short in time and price retracement.
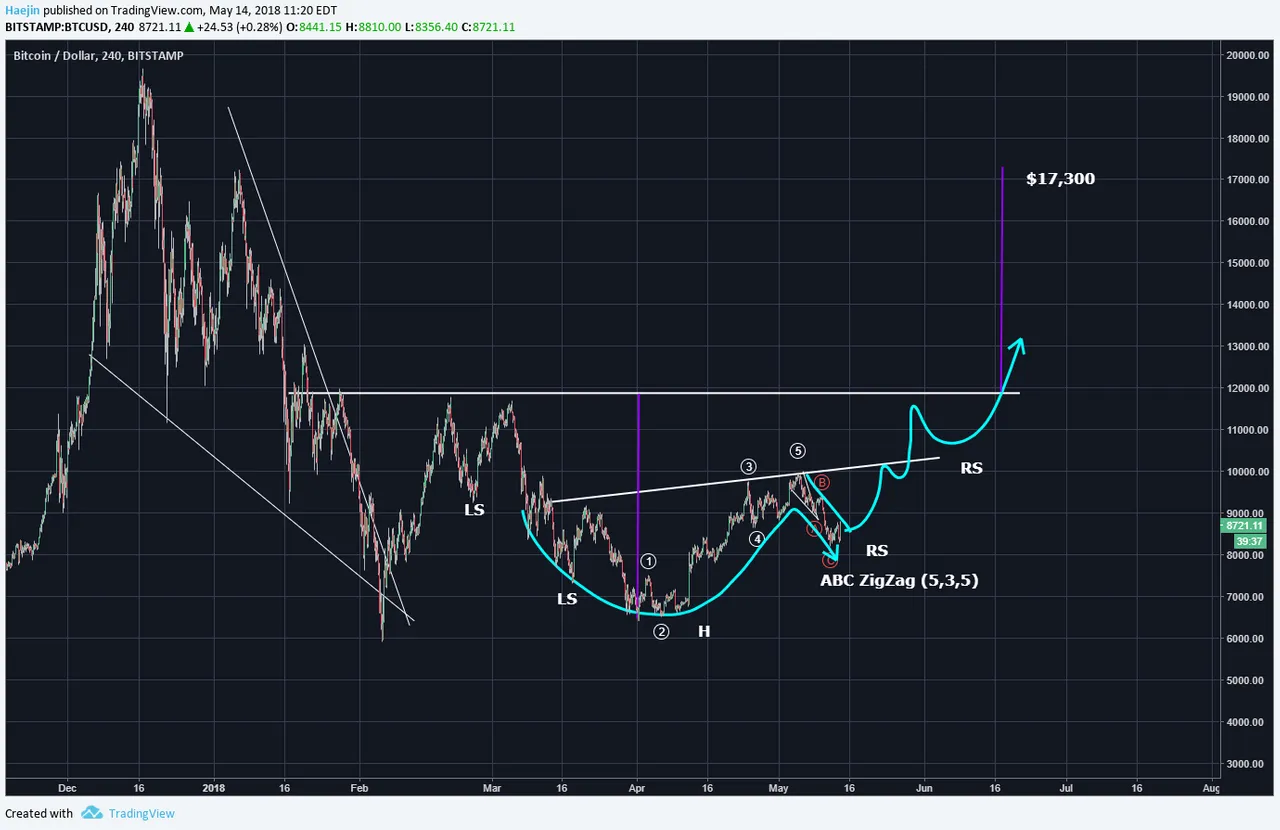
Now, the longer term chart is very interesting. The Cup & Handle (blue) is showing that the handle formation has matured quite well and nearly complete. The top and bottom blue lines of the handle correllate with the purple trend lines shown in the first chart. Bear in mind that the Cup & Handle is the combination of the rounded formation and a bull flag. The blue arrow outlines the price pathway that could lead to additional patterns. The LS, H and RS of an Inverted Head & Shows are outlined. This smaller one is then embeeded within a larger Inverte H&S pattern. The purple line is used to measure the minimum run potential and that marks it at $17,300 or so. And yes, as the video analysis shows, volume also confirms.
Legal Disclaimer: I am not a financial advisor nor is any content in this article presented as financial advice. The information provided in this blog post and any other posts that I make and any accompanying material is for informational purposes only. It should not be considered financial or investment advice of any kind. One should consult with a financial or investment professional to determine what may be best for your individual needs. Plain English: This is only my opinion, make of it what you wish. What does this mean? It means it's not advice nor recommendation to either buy or sell anything! It's only meant for use as informative or entertainment purposes.
Please consider reviewing these Tutorials on:
Elliott Wave Counting Tutorial #1
Elliott Wave Counting Tutorial #2
Elliott Wave Counting Tutorial #3
Laddering and Buy/Sell Setups.
Laddering Example with EOS
Tutorial on the use of Fibonacci & Elliott Waves
@haejin's Trading Nuggets
Essay: Is Technical Analysis a Quantum Event?
Follow me on Twitter for Real Time Alerts!!
Follow me on StockTwits for UpDates!!
--
--

