
SUMMARY
Bitcoin (BTC) has been able to breach the Neckline and remain above it as shown within the blue circle. There are occasions when price dips again below the Necline and resurfaces. The minimum target for this remains at $10,387. A pattern has two stages, completion and confirmation. By breaching above the neckline, price confirmation has been attained. The chart below also shows the volume confirmation where the Head volume is the highest.

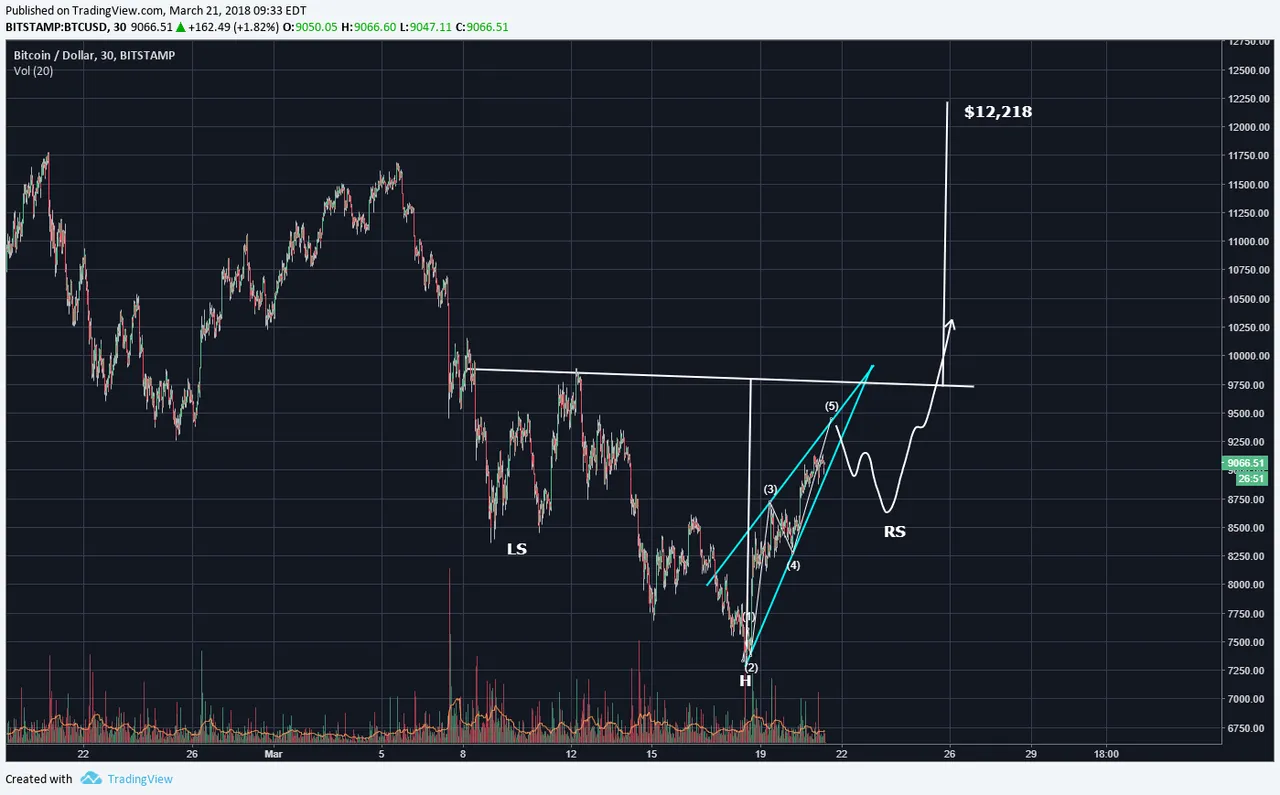
One pattern to consider is the below, where an upward pointing wedge could be in development. This is not the primary count, but keeping into awareness is key. The resulting abc correction would be expected if the five wave count is correct.

Forward discernment allows one to incorporate current evidence of price performance and project future pathway probabilities. The below chart shows how that upward wedge could fit into how the Right Shouler (RS) of a larger degree of trend Inverted Head & Shoulders could be formed. IF this pattern also completes and confirms, the the minimum target would be $12,218. This would allow the breaching of that $11,800 resitance zone that had repelled the price now twice.
Legal Disclaimer: I am not a financial advisor nor is any content in this article presented as financial advice. The information provided in this blog post and any other posts that I make and any accompanying material is for informational purposes only. It should not be considered financial or investment advice of any kind. One should consult with a financial or investment professional to determine what may be best for your individual needs. Plain English: This is only my opinion, make of it what you wish. What does this mean? It means it's not advice nor recommendation to either buy or sell anything! It's only meant for use as informative or entertainment purposes.
Please consider reviewing these Tutorials on:
Elliott Wave Counting Tutorial #1
Elliott Wave Counting Tutorial #2
Elliott Wave Counting Tutorial #3
Laddering and Buy/Sell Setups.
Laddering Example with EOS
Tutorial on the use of Fibonacci & Elliott Waves
@haejin's Trading Nuggets
Essay: Is Technical Analysis a Quantum Event?
Follow me on Twitter for Real Time Alerts!!
Follow me on StockTwits for UpDates!!
--
--

