
SUMMARY
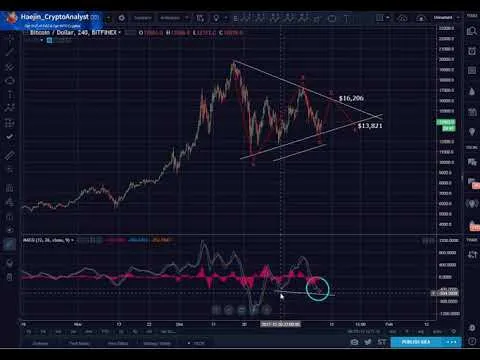
Overnight, price action has started bouncing off the bottom of the price with the MACD curling back upwards. This can be seen in the below chart for the triangle pattern which is my primary count. If the bounce is hapening now, then $16,206 should be the wave d zone and price should then decline towards the $13,821 zone to complete the e wave.

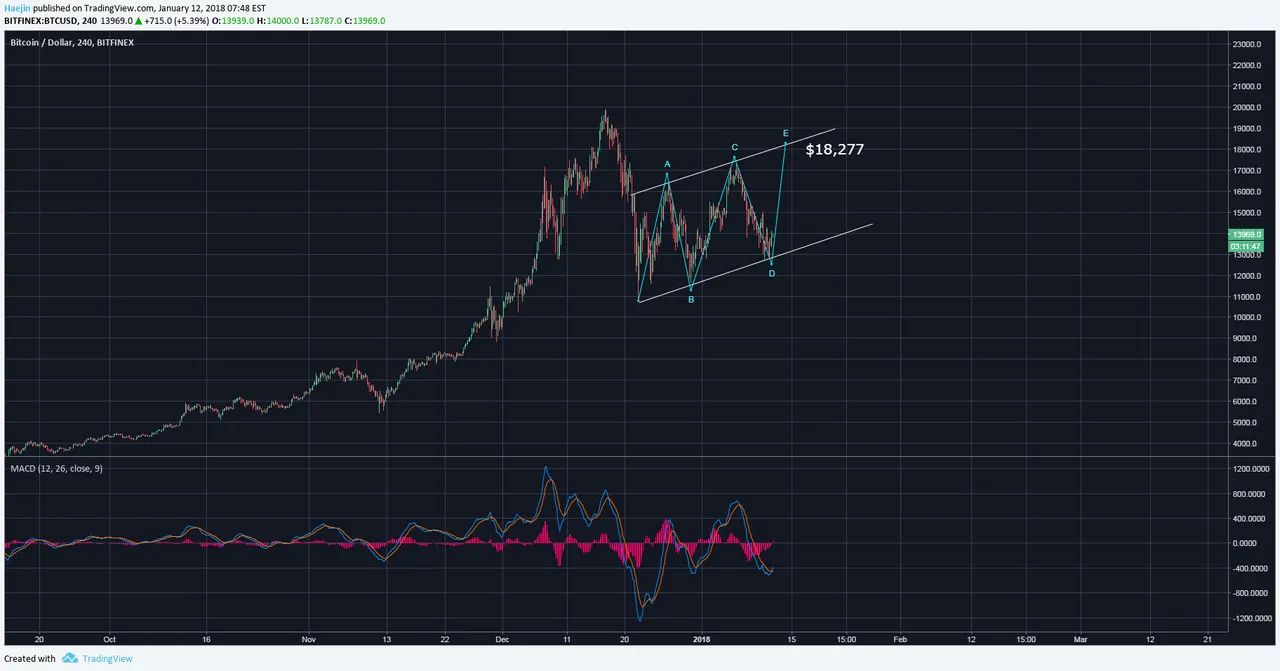
Below is the chart for the bear flag alternate count. The MACD also is curling up just like it is for the triangle pattern but price in this bear flag pattern could enable a bounce towards $18,277 for the blue E wave. So the key is that if price exceeds $16,206; then likely the blue E wave is in play. IF price bounces down from the $16,206; then likely the final red e wave of the triangle is in play. So, let's see how the day time price action carries on.
Please consider reviewing these Tutorials on:
Elliott Wave Counting Tutorial #1
Elliott Wave Counting Tutorial #2
Elliott Wave Counting Tutorial #3
Laddering and Buy/Sell Setups.
Laddering Example with EOS
Tutorial on the use of Fibonacci & Elliott Waves
These Technical Analysis Books: Elliott Wave Priniciple & Technical Analysis of Stock Trends are highly recommended
@haejin's Trading Nuggets
Essay: Is Technical Analysis a Quantum Event?
Follow me on Twitter for Real Time Alerts!!
Follow me on StockTwits for UpDates!!
--
--

If this blog post has entertained or helped you to profit, please follow, upvote, resteem and/or consider buying me a beer:
BTS Wallet - haejin1970
BTC Wallet - 1HMFpq4tC7a2acpjD45hCT4WqPNHXcqpof
ETH Wallet - 0x1Ab87962dD59BBfFe33819772C950F0B38554030
LTC Wallet - LecCNCzkt4vjVq2i3bgYiebmr9GbYo6FQf

Legal Disclaimer: This is only my opinion, make of it what you wish. What does this mean? It means it's not advice nor recommendation to either buy or sell anything! It's only meant for use as informative or entertainment purposes.