
SUMMARY
Note: For anyone who missed the BitcoinLive Information Webinar, here is the replay link: 
As of June 4th, ALL Crypto Analysis will be posted on the BitcoinLive channel and Steemit will be dedicated for Equity, Commodity and Option Analysis. To Signup for the BitcoinLive limited Founding Membership slots, use this link: https://get.bitcoin.live/haejin/
__
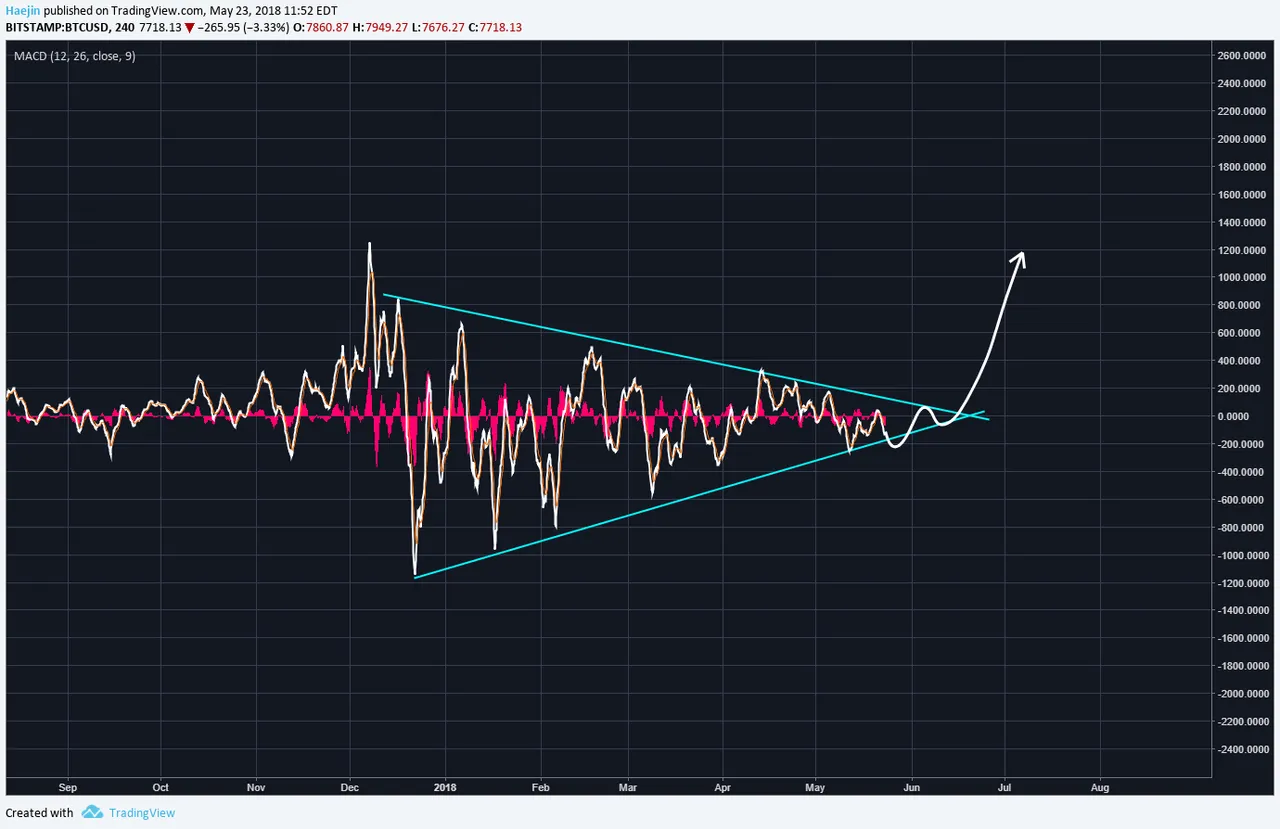
Here is the MACD indicator for Bitcoin (BTC). When viewing the price action in terms of this chart, nothing really has changed. It's still moving well within the contracting lines of the symmetrical triangle. It can and likely will but probably temporarily pierce the lower bottom trend line as shown by the white arrow. However, each day brings the MACD more and more proximal to the apex. I believe the bias is to the upside breakout (white arrow).
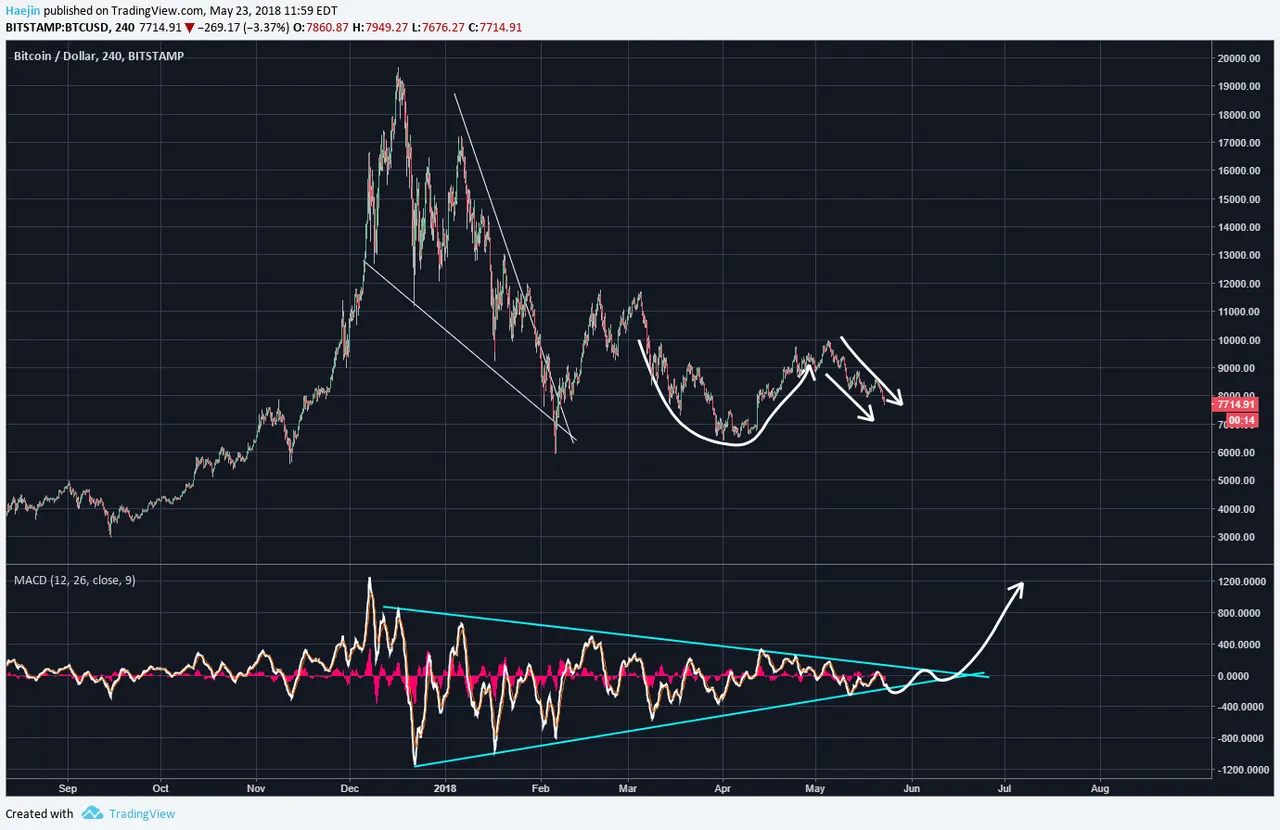
When viewing it with the price chart, you can see how the MACD movements are translated. Let's see what's changed. The Cup & Handle pattern remains valid. The current decline is a healthy correction from the recent five wave up move. Is it possible to have this pattern become invaldiated but still have the MACD within its pattern? Yes. However, the pattern doesn't become invalidated until the handle price goes lower than the lowest point in the cup formation. Discipline & Patience attract profits while Fear & Greed repel it.

Legal Disclaimer: I am not a financial advisor nor is any content in this article presented as financial advice. The information provided in this blog post and any other posts that I make and any accompanying material is for informational purposes only. It should not be considered financial or investment advice of any kind. One should consult with a financial or investment professional to determine what may be best for your individual needs. Plain English: This is only my opinion, make of it what you wish. What does this mean? It means it's not advice nor recommendation to either buy or sell anything! It's only meant for use as informative or entertainment purposes.
Please consider reviewing these Tutorials on:
Elliott Wave Counting Tutorial #1
Elliott Wave Counting Tutorial #2
Elliott Wave Counting Tutorial #3
Laddering and Buy/Sell Setups.
Laddering Example with EOS
Tutorial on the use of Fibonacci & Elliott Waves
@haejin's Trading Nuggets
Essay: Is Technical Analysis a Quantum Event?
Follow me on Twitter for Real Time Alerts!!
Follow me on StockTwits for UpDates!!
--
--

