
SUMMARY
Note: Still on the road with very slow WiFi and so no videos which should return this weekend or next week.
The below chart shows a snapshot of the September 2017 correction which has pretty good fractal similarity to current correction. From the bottom, price had moved in what looked like a three wave counter trend (white arrow) and naturally many thought it was an abc and that lower lows were dead ahead. I had disagreed and labeled the first peak as blue wave 1 and the decline as blue wave 2. Price then started impulsing upwards again with steady volume.
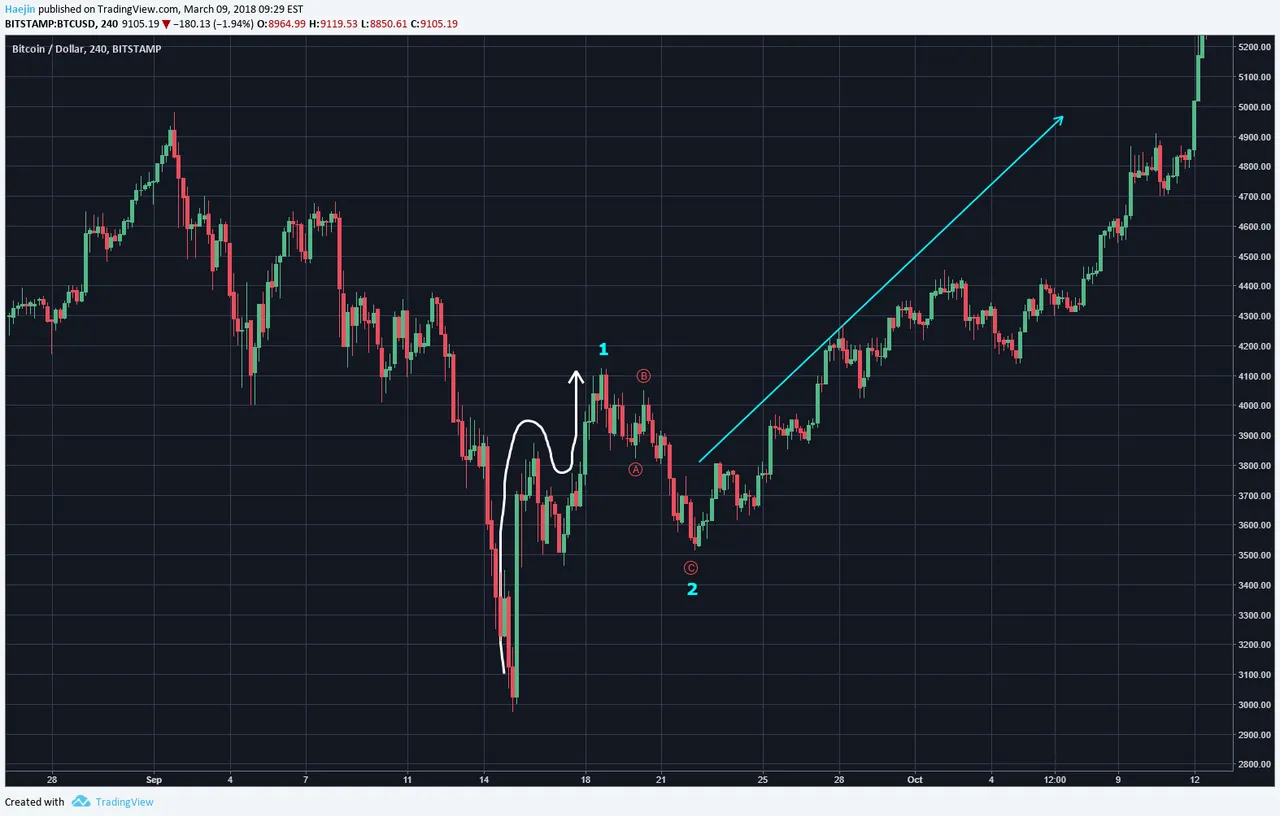
The primary reason I had disagreed with the crowd was because of the monstrous volume that usually marks the bottom of corrections. When there is a downtrend that literally turns on the dime with ferocity of panic buying that drives volume levels to jaw dropping levels....it signals that it's NOT just a passing milestone for lower lows.

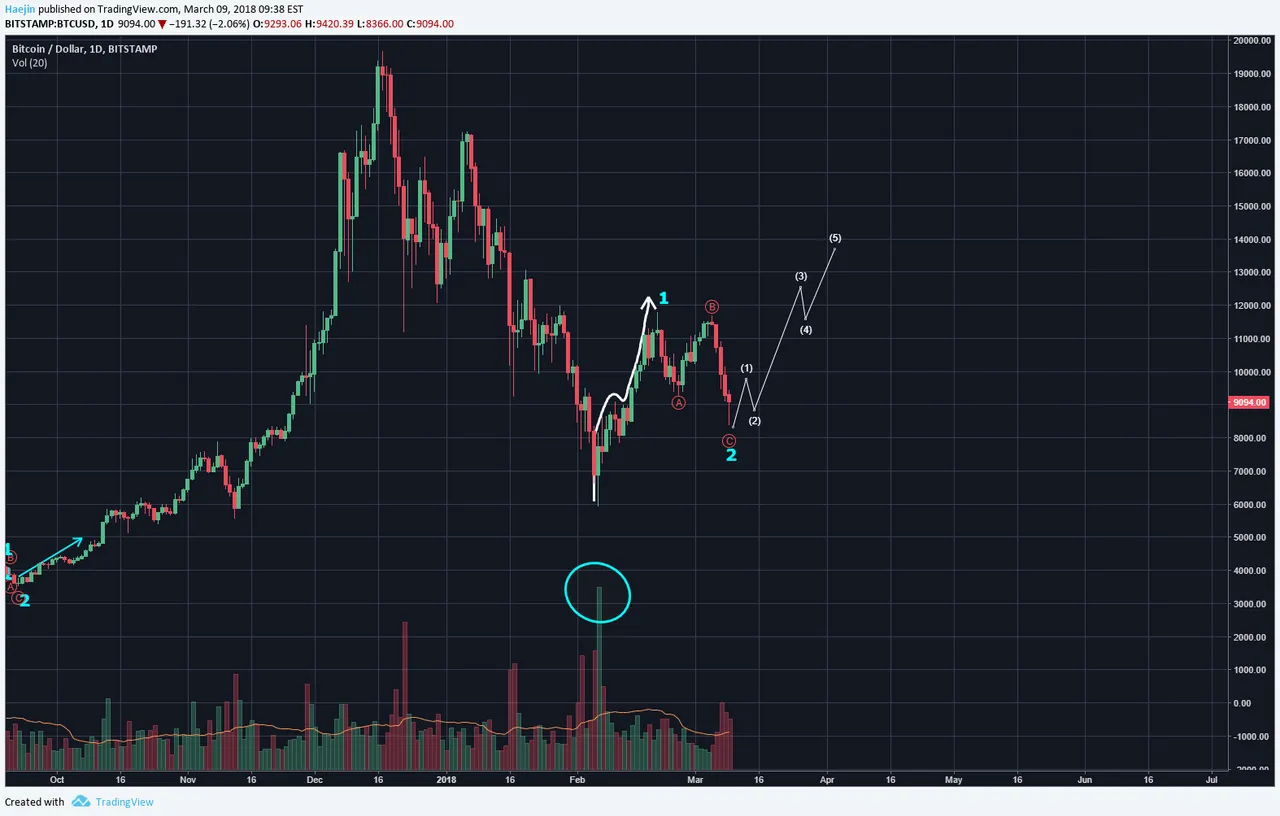
This chart shows the current correction. It too shows what looks like a three wave bounce from the $5,900 level. I've labeled the peak as blue wave 1 and the minor correction which I had called to start in the weekend posts is labeled with blue 2. The white Elliott Waves are tentative for now but IF blue 2 is complete or near so; then we need to see an impulse motive.

The current correction too turned on the dime with monstrous panic buying volume. As it was in September, today also, the same volume indicator is keeping me from going full bearish.
Legal Disclaimer: I am not a financial advisor nor is any content in this article presented as financial advice. The information provided in this blog post and any other posts that I make and any accompanying material is for informational purposes only. It should not be considered financial or investment advice of any kind. One should consult with a financial or investment professional to determine what may be best for your individual needs. Plain English: This is only my opinion, make of it what you wish. What does this mean? It means it's not advice nor recommendation to either buy or sell anything! It's only meant for use as informative or entertainment purposes.
Please consider reviewing these Tutorials on:
Elliott Wave Counting Tutorial #1
Elliott Wave Counting Tutorial #2
Elliott Wave Counting Tutorial #3
Laddering and Buy/Sell Setups.
Laddering Example with EOS
Tutorial on the use of Fibonacci & Elliott Waves
@haejin's Trading Nuggets
Essay: Is Technical Analysis a Quantum Event?
Follow me on Twitter for Real Time Alerts!!
Follow me on StockTwits for UpDates!!
--
--

