
SUMMARY
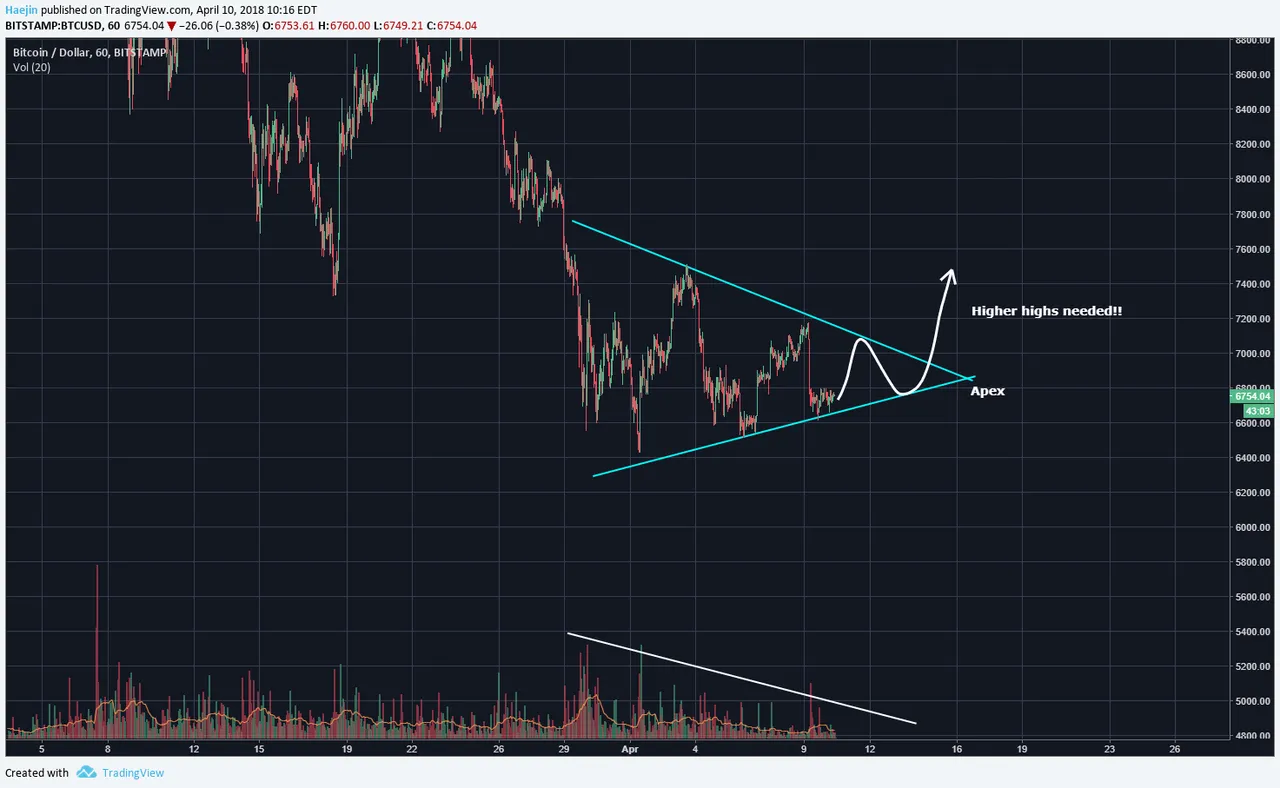
In looking at the short term chart of Bitcoin (BTC), a series of higher lows and lower highs can be seen and the lines show a symmetrical triangle pattern being formed. This pattern represents a consolidation phase without much indication into direction of breakout....it can literally break upwards or downwards and often the direction of breach is unknown until it happens. IF the breakout is upwards, Bitcoin (BTC) must start putting in some higher highs. It is the only way to establish a trend reversal start. Personally, I require two rounds of impulse motives as the first range of confirmation. The volume is declining and by the time price does get proximal to the apex; it'll likely trickle to almost nothing.
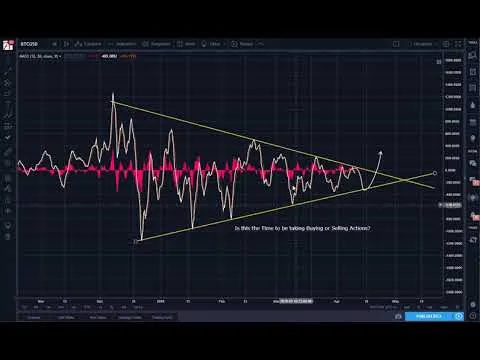
I'm giving bias to the upside because since the start of this correction in late December, sellers have repeatedly tried to strike down Bitcoin with all their might. The Seller strength can be measured in various ways and the below shows the MACD moving well within the contracting lines. The mobility of the MACD is very limited. Yes, while the MACD can break downwards; that'll require some serious renewal of seller mojo. BTC should get some degree of directional resolution within the coming week or so.

Legal Disclaimer: I am not a financial advisor nor is any content in this article presented as financial advice. The information provided in this blog post and any other posts that I make and any accompanying material is for informational purposes only. It should not be considered financial or investment advice of any kind. One should consult with a financial or investment professional to determine what may be best for your individual needs. Plain English: This is only my opinion, make of it what you wish. What does this mean? It means it's not advice nor recommendation to either buy or sell anything! It's only meant for use as informative or entertainment purposes.
Please consider reviewing these Tutorials on:
Elliott Wave Counting Tutorial #1
Elliott Wave Counting Tutorial #2
Elliott Wave Counting Tutorial #3
Laddering and Buy/Sell Setups.
Laddering Example with EOS
Tutorial on the use of Fibonacci & Elliott Waves
@haejin's Trading Nuggets
Essay: Is Technical Analysis a Quantum Event?
Follow me on Twitter for Real Time Alerts!!
Follow me on StockTwits for UpDates!!
--
--

