
SUMMARY
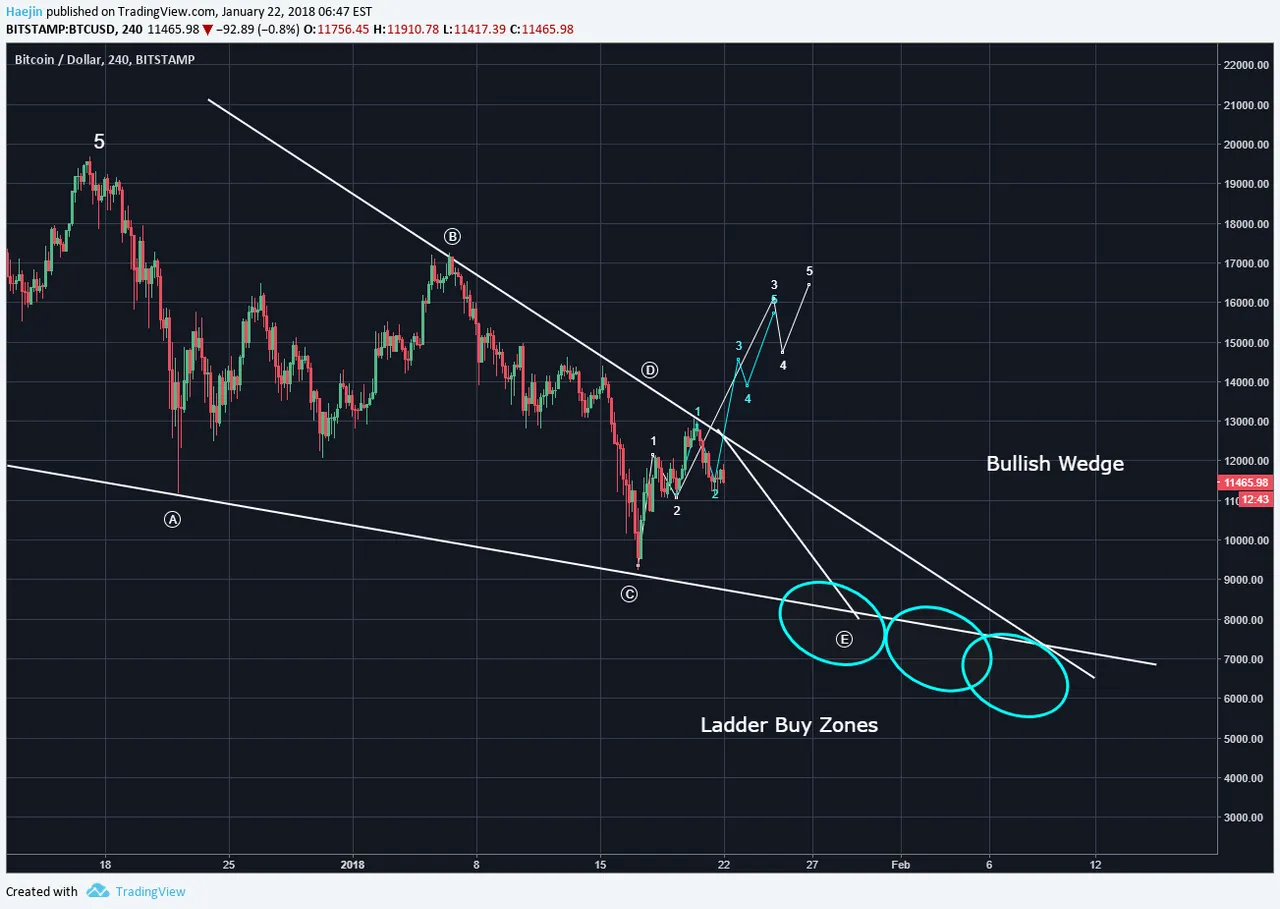
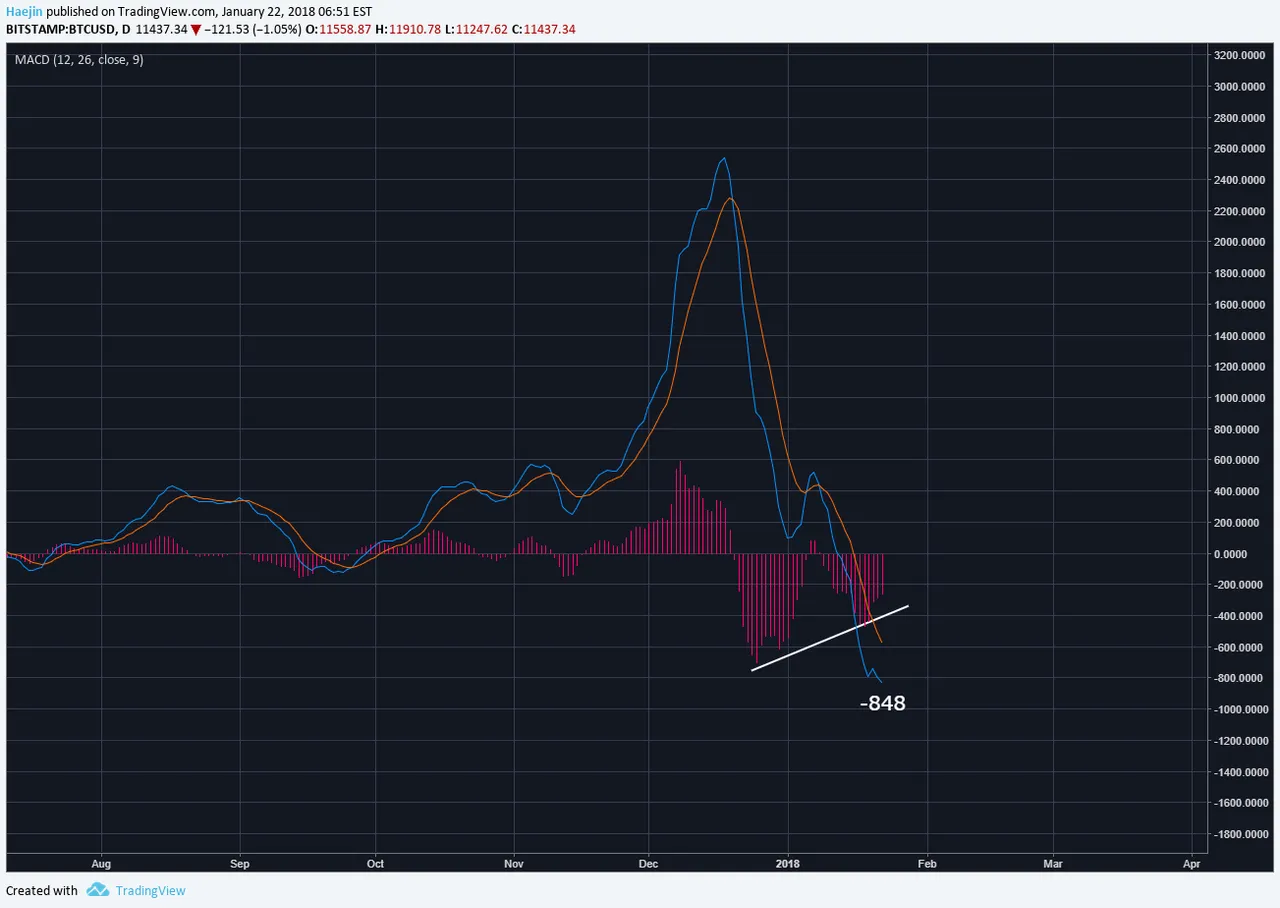
I keep getting asked for what the Bullish scenario would be and the below chart depicts it. Price would have to rise above the top white line of the descending wedge pattern and such likelihood is supported by the very oversold nature of the MACD. However, I still prefer the lower low for the e wave to execute as such would be the more bullish scenario in the longer run. Downward pointing wedge formations are quite bullish once it is completed and confirmed. IF price can breach teh upper white line, I've placed the Elliott Waves to show a potential pathway.
The MACD is still showing a lower, newer record low at -848. IF the lower low happens, then MACD could reach -1,000 or a bit lower. The oversold nature is quite extreme and the rubber band can only stretch so much. This correction too shall pass.
Legal Disclaimer: This is only my opinion, make of it what you wish. What does this mean? It means it's not advice nor recommendation to either buy or sell anything! It's only meant for use as informative or entertainment purposes.
Please consider reviewing these Tutorials on:
Elliott Wave Counting Tutorial #1
Elliott Wave Counting Tutorial #2
Elliott Wave Counting Tutorial #3
Laddering and Buy/Sell Setups.
Laddering Example with EOS
Tutorial on the use of Fibonacci & Elliott Waves
These Technical Analysis Books: Elliott Wave Priniciple & Technical Analysis of Stock Trends are highly recommended
@haejin's Trading Nuggets
Essay: Is Technical Analysis a Quantum Event?
Follow me on Twitter for Real Time Alerts!!
Follow me on StockTwits for UpDates!!
--
--

If this blog post has entertained or helped you to profit, please follow, upvote, resteem and/or consider buying me a beer:
BTC Wallet - 1HMFpq4tC7a2acpjD45hCT4WqPNHXcqpof
ETH Wallet - 0x1Ab87962dD59BBfFe33819772C950F0B38554030
LTC Wallet - LecCNCzkt4vjVq2i3bgYiebmr9GbYo6FQf
