
SUMMARY
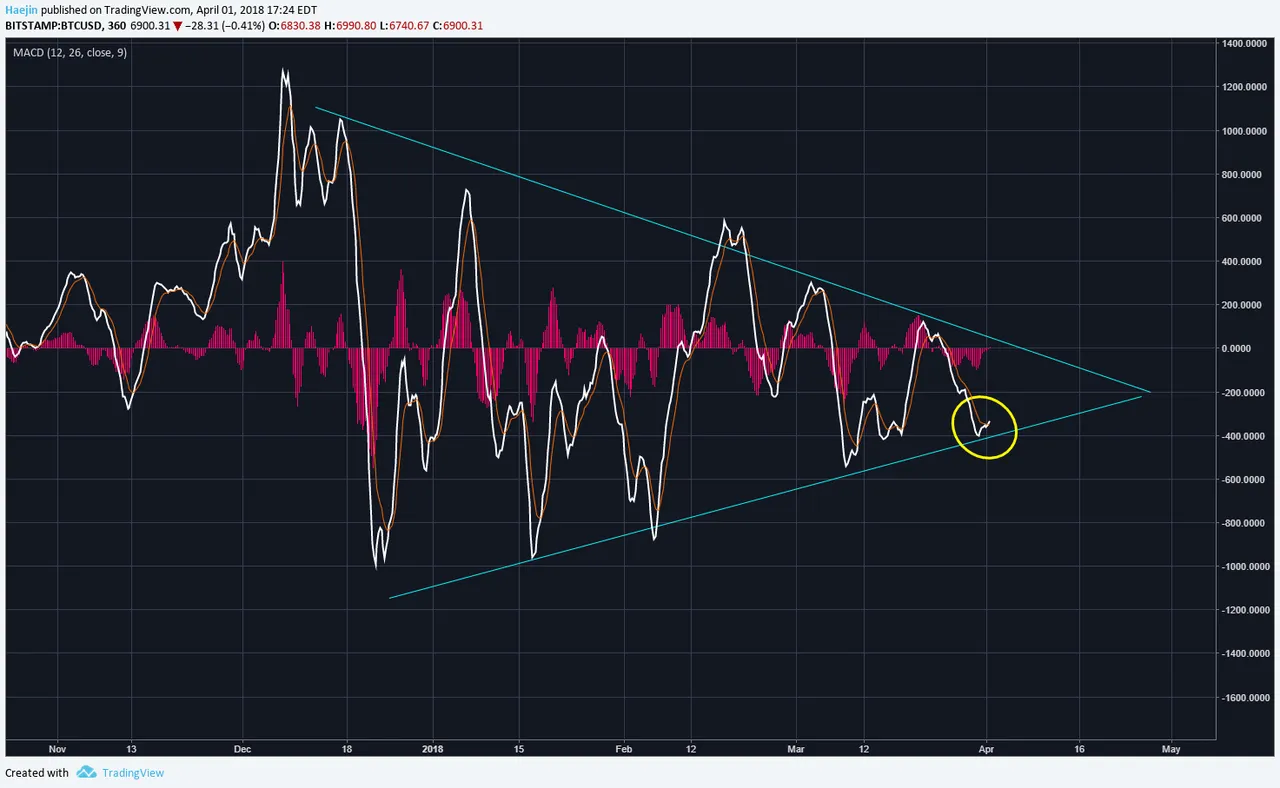
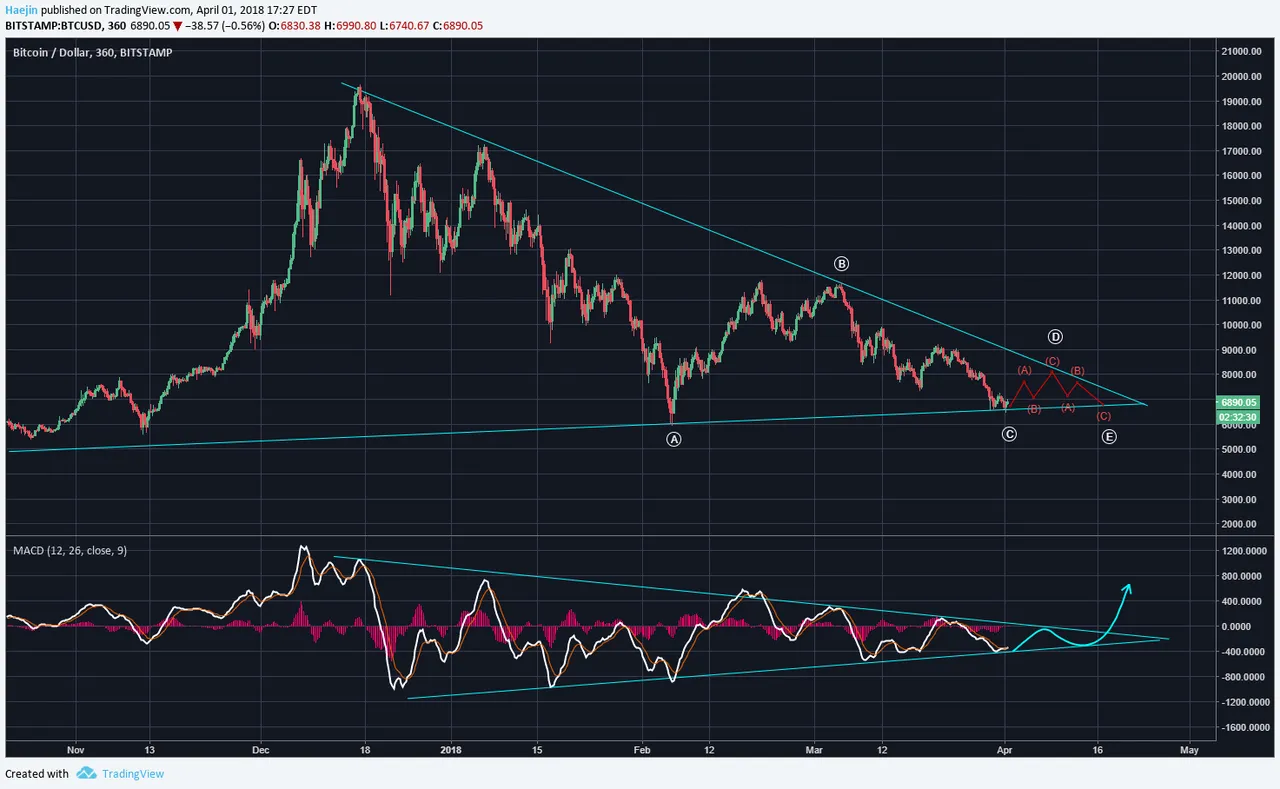
Bitcoin (BTC) is holding its supports in both the MACD and the price. The below chart shows that the MACD si curling upwards and thus the next likely stop is to rise towards the upper blue resistance trend line (yellow circle).
The price chart has been relabled with white ABCDE Elliott Waves. It follows and jives with the MACD pattern quite well. So, today, perhaps we saw the completion of white wave C and overnight white wave D be initiated. The blue arrow shows the probable MACD pathway to enable the completion of price waves D and E; each of which subdivides to a three wave abc (red).
Legal Disclaimer: I am not a financial advisor nor is any content in this article presented as financial advice. The information provided in this blog post and any other posts that I make and any accompanying material is for informational purposes only. It should not be considered financial or investment advice of any kind. One should consult with a financial or investment professional to determine what may be best for your individual needs. Plain English: This is only my opinion, make of it what you wish. What does this mean? It means it's not advice nor recommendation to either buy or sell anything! It's only meant for use as informative or entertainment purposes.
Please consider reviewing these Tutorials on:
Elliott Wave Counting Tutorial #1
Elliott Wave Counting Tutorial #2
Elliott Wave Counting Tutorial #3
Laddering and Buy/Sell Setups.
Laddering Example with EOS
Tutorial on the use of Fibonacci & Elliott Waves
@haejin's Trading Nuggets
Essay: Is Technical Analysis a Quantum Event?
Follow me on Twitter for Real Time Alerts!!
Follow me on StockTwits for UpDates!!
--
--

