
SUMMARY
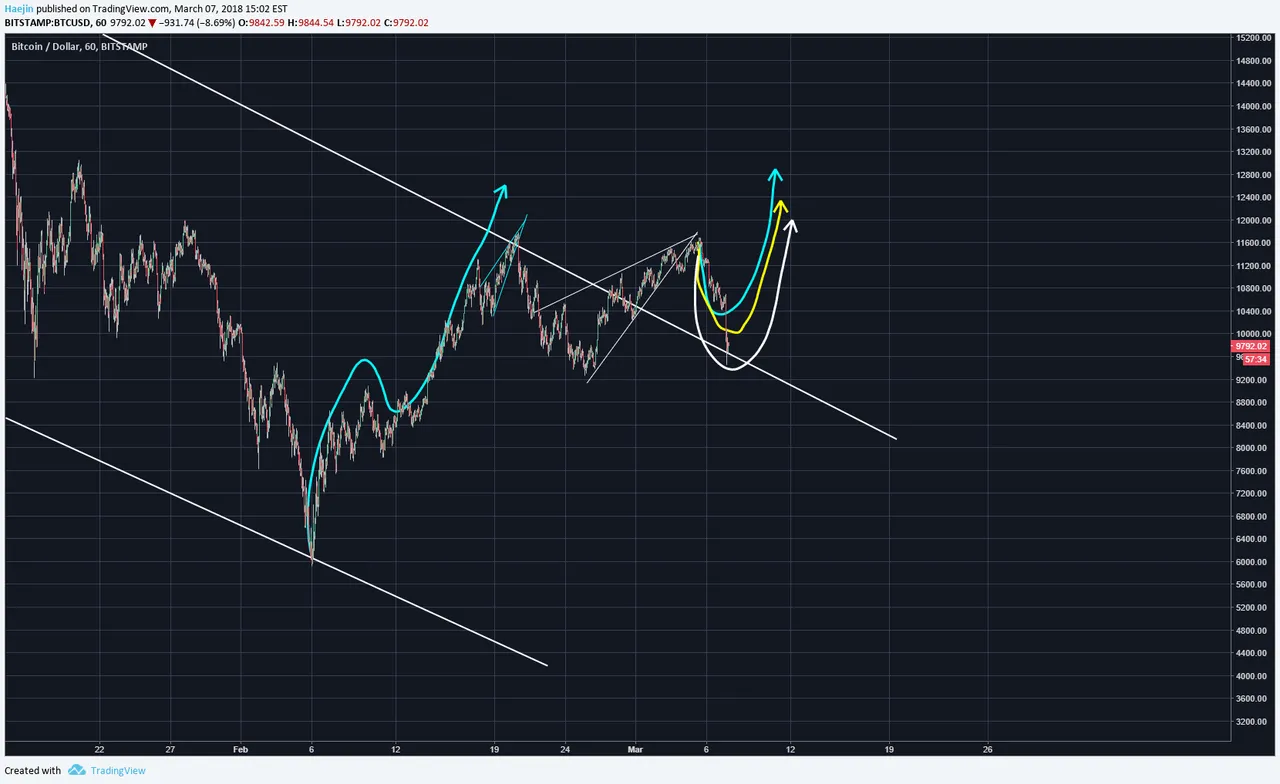
Bitcoin (BTC) daily chart shows price to be sitting on the upper white trend line as support. This morning's update has stated that a temporary piercing of the support line would generate bull wicks and these could washout the weak hands. The daily MACD has the 12 day curling downwards and a clean cross could signal more down; but that has not yet occurred.

The Bollinger band's +/- 2 Std Dev bands show price to be sitting on the bottom band which coincides well with upper white trend line. A good support should be experienced. Let's see if the bands start diverging or not for the rest of the day.
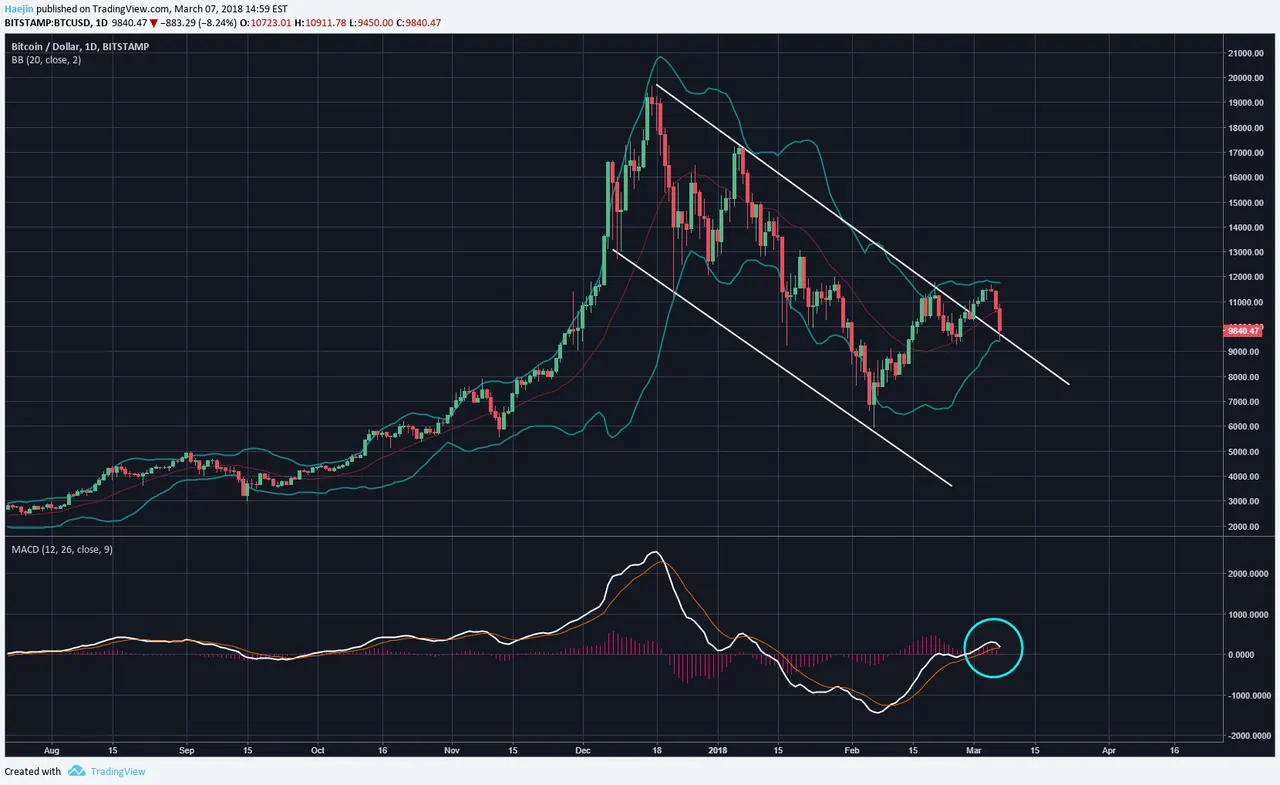
I have updated the white arrow pathway to take into consideration the Bull Wick potentials.
Legal Disclaimer: I am not a financial advisor nor is any content in this article presented as financial advice. The information provided in this blog post and any other posts that I make and any accompanying material is for informational purposes only. It should not be considered financial or investment advice of any kind. One should consult with a financial or investment professional to determine what may be best for your individual needs. Plain English: This is only my opinion, make of it what you wish. What does this mean? It means it's not advice nor recommendation to either buy or sell anything! It's only meant for use as informative or entertainment purposes.
Please consider reviewing these Tutorials on:
Elliott Wave Counting Tutorial #1
Elliott Wave Counting Tutorial #2
Elliott Wave Counting Tutorial #3
Laddering and Buy/Sell Setups.
Laddering Example with EOS
Tutorial on the use of Fibonacci & Elliott Waves
@haejin's Trading Nuggets
Essay: Is Technical Analysis a Quantum Event?
Follow me on Twitter for Real Time Alerts!!
Follow me on StockTwits for UpDates!!
--
--

