
SUMMARY
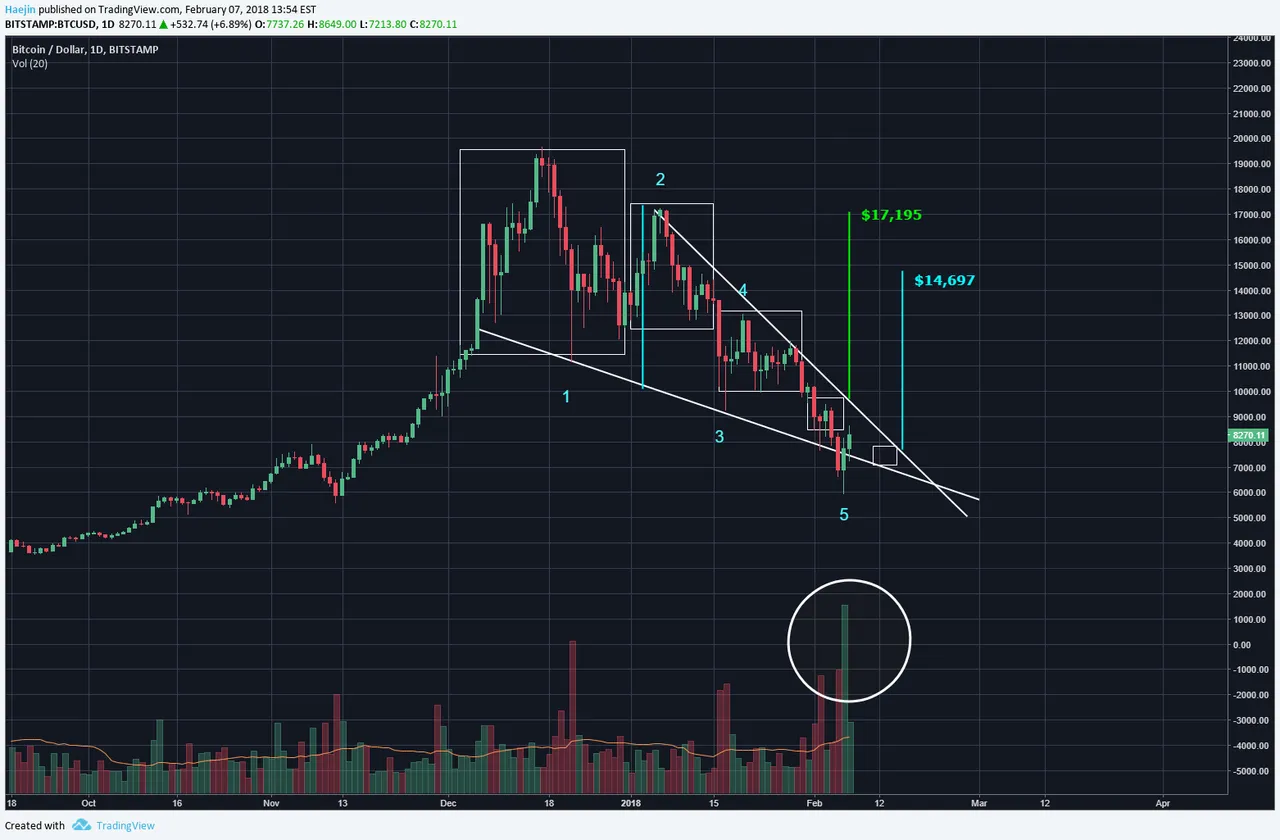
IF price breached the upper white line of the wedge pattern, it could do so within the current retracement. The below chart shows the last two boxes at which the breakout can happen. Note the MASSIVE volume spike which is indicative of an approaching bottom. IF wave 5 is complete; more serious upside actions can be expected.

The width of the wedge triangle is used to measure an approximate breakout price distance. IF the breakout occurred at current rise; the target would be $17,195. The green vertical line which equals the widthe of the wedge at the widest point is placed on the estimated point of top line breach. IF price decides to decline to gain greater proximity to the Apex; the blue vertical line would represent an approximate breakout target.
Legal Disclaimer: This is only my opinion, make of it what you wish. What does this mean? It means it's not advice nor recommendation to either buy or sell anything! It's only meant for use as informative or entertainment purposes.
Please consider reviewing these Tutorials on:
Elliott Wave Counting Tutorial #1
Elliott Wave Counting Tutorial #2
Elliott Wave Counting Tutorial #3
Laddering and Buy/Sell Setups.
Laddering Example with EOS
Tutorial on the use of Fibonacci & Elliott Waves
@haejin's Trading Nuggets
Essay: Is Technical Analysis a Quantum Event?
Follow me on Twitter for Real Time Alerts!!
Follow me on StockTwits for UpDates!!
--
--

If this blog post has entertained or helped you to profit, please follow, upvote, resteem and/or consider buying me a beer:
BTC Wallet - 1HMFpq4tC7a2acpjD45hCT4WqPNHXcqpof
ETH Wallet - 0x1Ab87962dD59BBfFe33819772C950F0B38554030
LTC Wallet - LecCNCzkt4vjVq2i3bgYiebmr9GbYo6FQf
