
SUMMARY
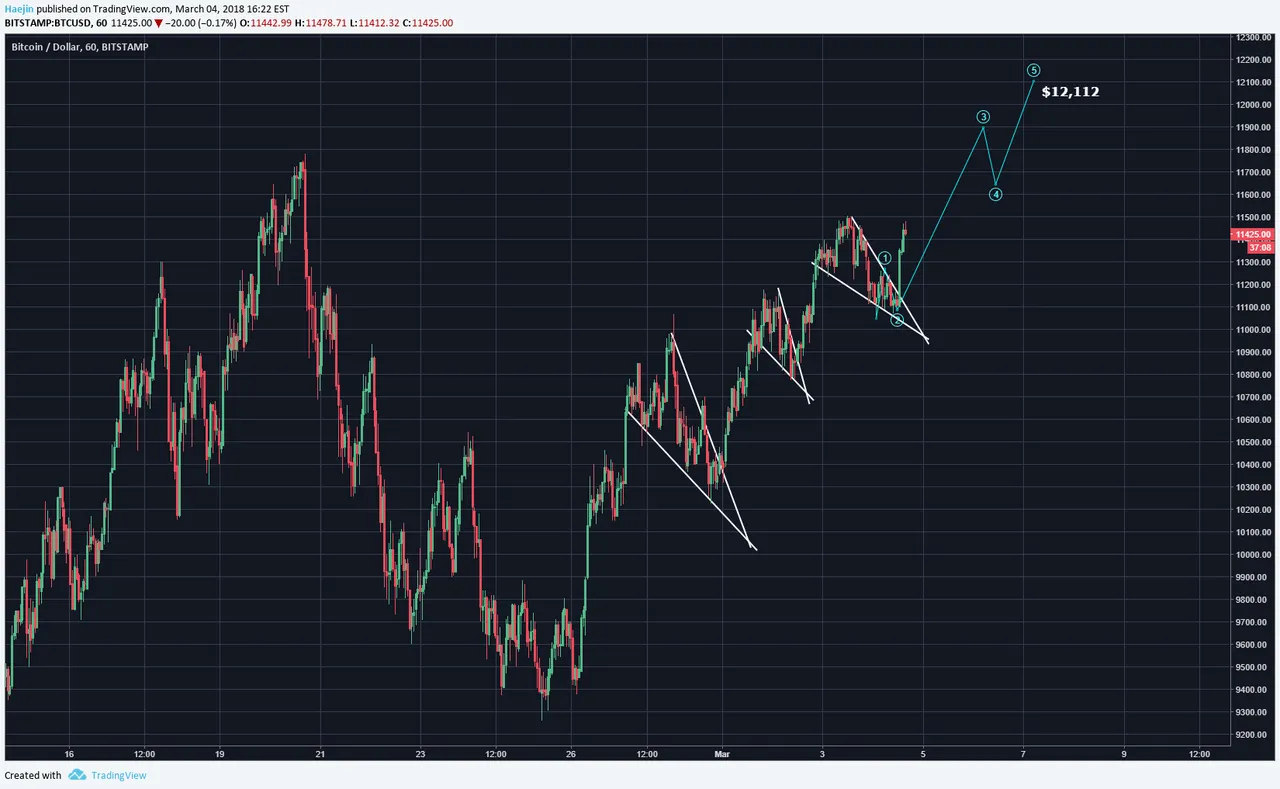
The wedge I had shown in this morning's update had price breakdown below the lower support line. Price has been rising and now is hitting against the belly side of the wedge pattern. Price can be repelled by the lower blue line and that is yet to be seen.

Closeup shows a serires of downward wedges and each resulted in a move higher that the prior peak. What's interesting is that these are all contained within the larger blue upward wedge. The current breakout is showing strength and the blue Elliott Waves show a projected price pathway towards $12,112. That would mark a higher high at a daily scale. More to come in tonight's evening update!
Legal Disclaimer: I am not a financial advisor nor is any content in this article presented as financial advice. The information provided in this blog post and any other posts that I make and any accompanying material is for informational purposes only. It should not be considered financial or investment advice of any kind. One should consult with a financial or investment professional to determine what may be best for your individual needs. Plain English: This is only my opinion, make of it what you wish. What does this mean? It means it's not advice nor recommendation to either buy or sell anything! It's only meant for use as informative or entertainment purposes.
Please consider reviewing these Tutorials on:
Elliott Wave Counting Tutorial #1
Elliott Wave Counting Tutorial #2
Elliott Wave Counting Tutorial #3
Laddering and Buy/Sell Setups.
Laddering Example with EOS
Tutorial on the use of Fibonacci & Elliott Waves
@haejin's Trading Nuggets
Essay: Is Technical Analysis a Quantum Event?
Follow me on Twitter for Real Time Alerts!!
Follow me on StockTwits for UpDates!!
--
--

