
SUMMARY
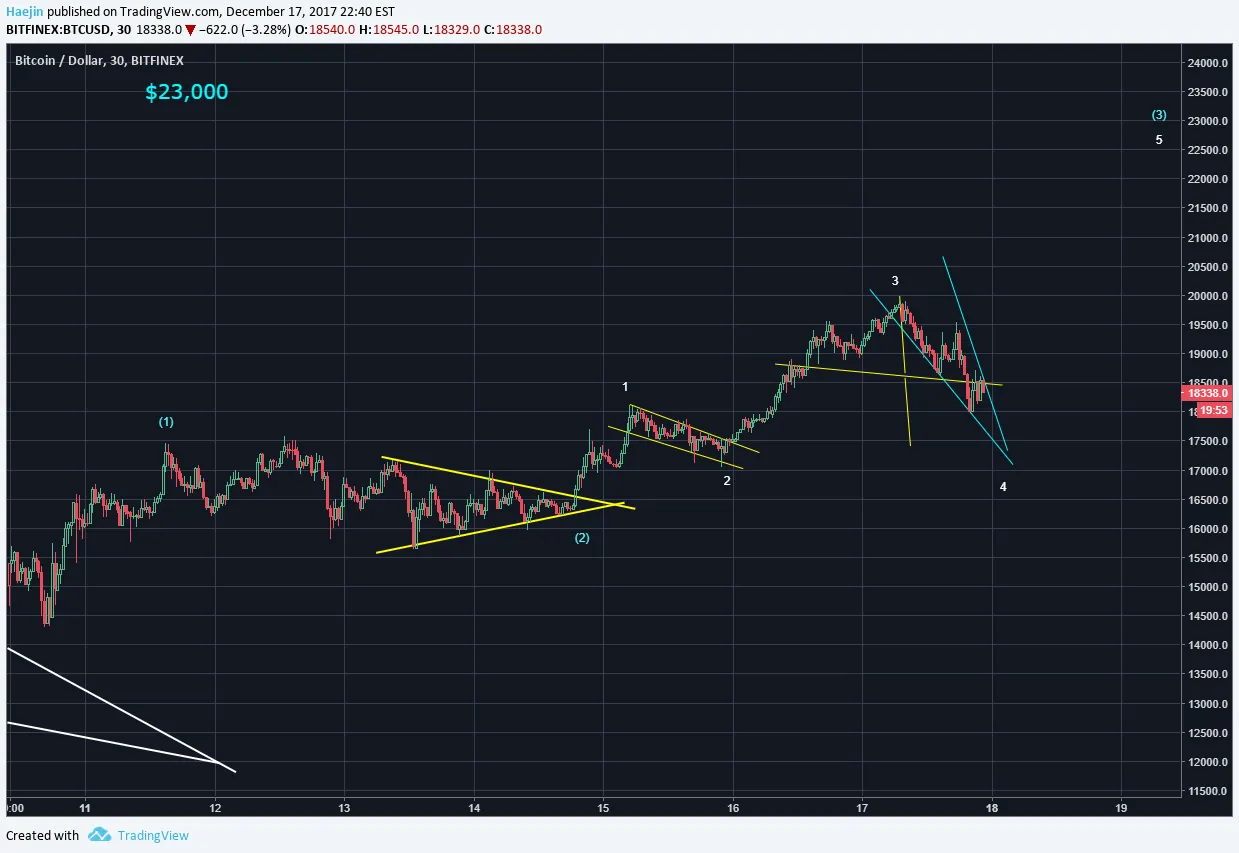
Daytime price action has been forming a wedge pattern for white wave 4. Look at all the triangle patterns....most usually, a triangle is a wave 4 or a wave 2. The same for flag patterns, they are often wave 2 or wave 4. The MACD below is reaching oversold zone and the leading indicator (white) should curl up and cross above the red lagging indicator (green circle).

I do spot a small Head & Shoulders as shown below. However, the minimum price travel equates to the apex of the blue wedge formation. Price could meander laterally a bit as well...but I believe the $23k target is being very patient.

Please consider reviewing these Tutorials on:
Elliott Wave Counting Tutorial #1
Elliott Wave Counting Tutorial #2
Elliott Wave Counting Tutorial #3
Laddering and Buy/Sell Setups.
Laddering Example with EOS
Tutorial on the use of Fibonacci & Elliott Waves
These Technical Analysis Books: Elliott Wave Priniciple & Technical Analysis of Stock Trends are highly recommended
@haejin's Trading Nuggets
Essay: Is Technical Analysis a Quantum Event?
Follow me on Twitter for Real Time Alerts!!
--

If this blog post has entertained or helped you to profit, please follow, upvote, resteem and/or consider buying me a beer:
BTS Wallet - haejin1970
BTC Wallet - 1HMFpq4tC7a2acpjD45hCT4WqPNHXcqpof
ETH Wallet - 0x1Ab87962dD59BBfFe33819772C950F0B38554030
LTC Wallet - LecCNCzkt4vjVq2i3bgYiebmr9GbYo6FQf

Legal Mumbo Jumbo: This is only my opinion, make of it what you wish. What does this mean? It means it's not advice nor recommendation to either buy or sell anything! It's only meant for use as informative or entertainment purposes.**